Two yogurt manufacturers produce similar products. Customer feedback differs dramatically:
Manufacturer A: "Quality varies batch to batch--sometimes creamy, sometimes runny. Inconsistent." Manufacturer B: "Every container tastes/feels the same. Reliable quality."
Same market, different outcomes. Manufacturer B's consistency builds customer trust and premium positioning.
The Quality Control Framework
Quality Parameters:
| Parameter | Type | Measurement | Standard |
|---|---|---|---|
| Flavor | Sensory | Trained panel tasting | Consistent profile |
| Texture | Sensory | Trained panel evaluation | Creamy consistency |
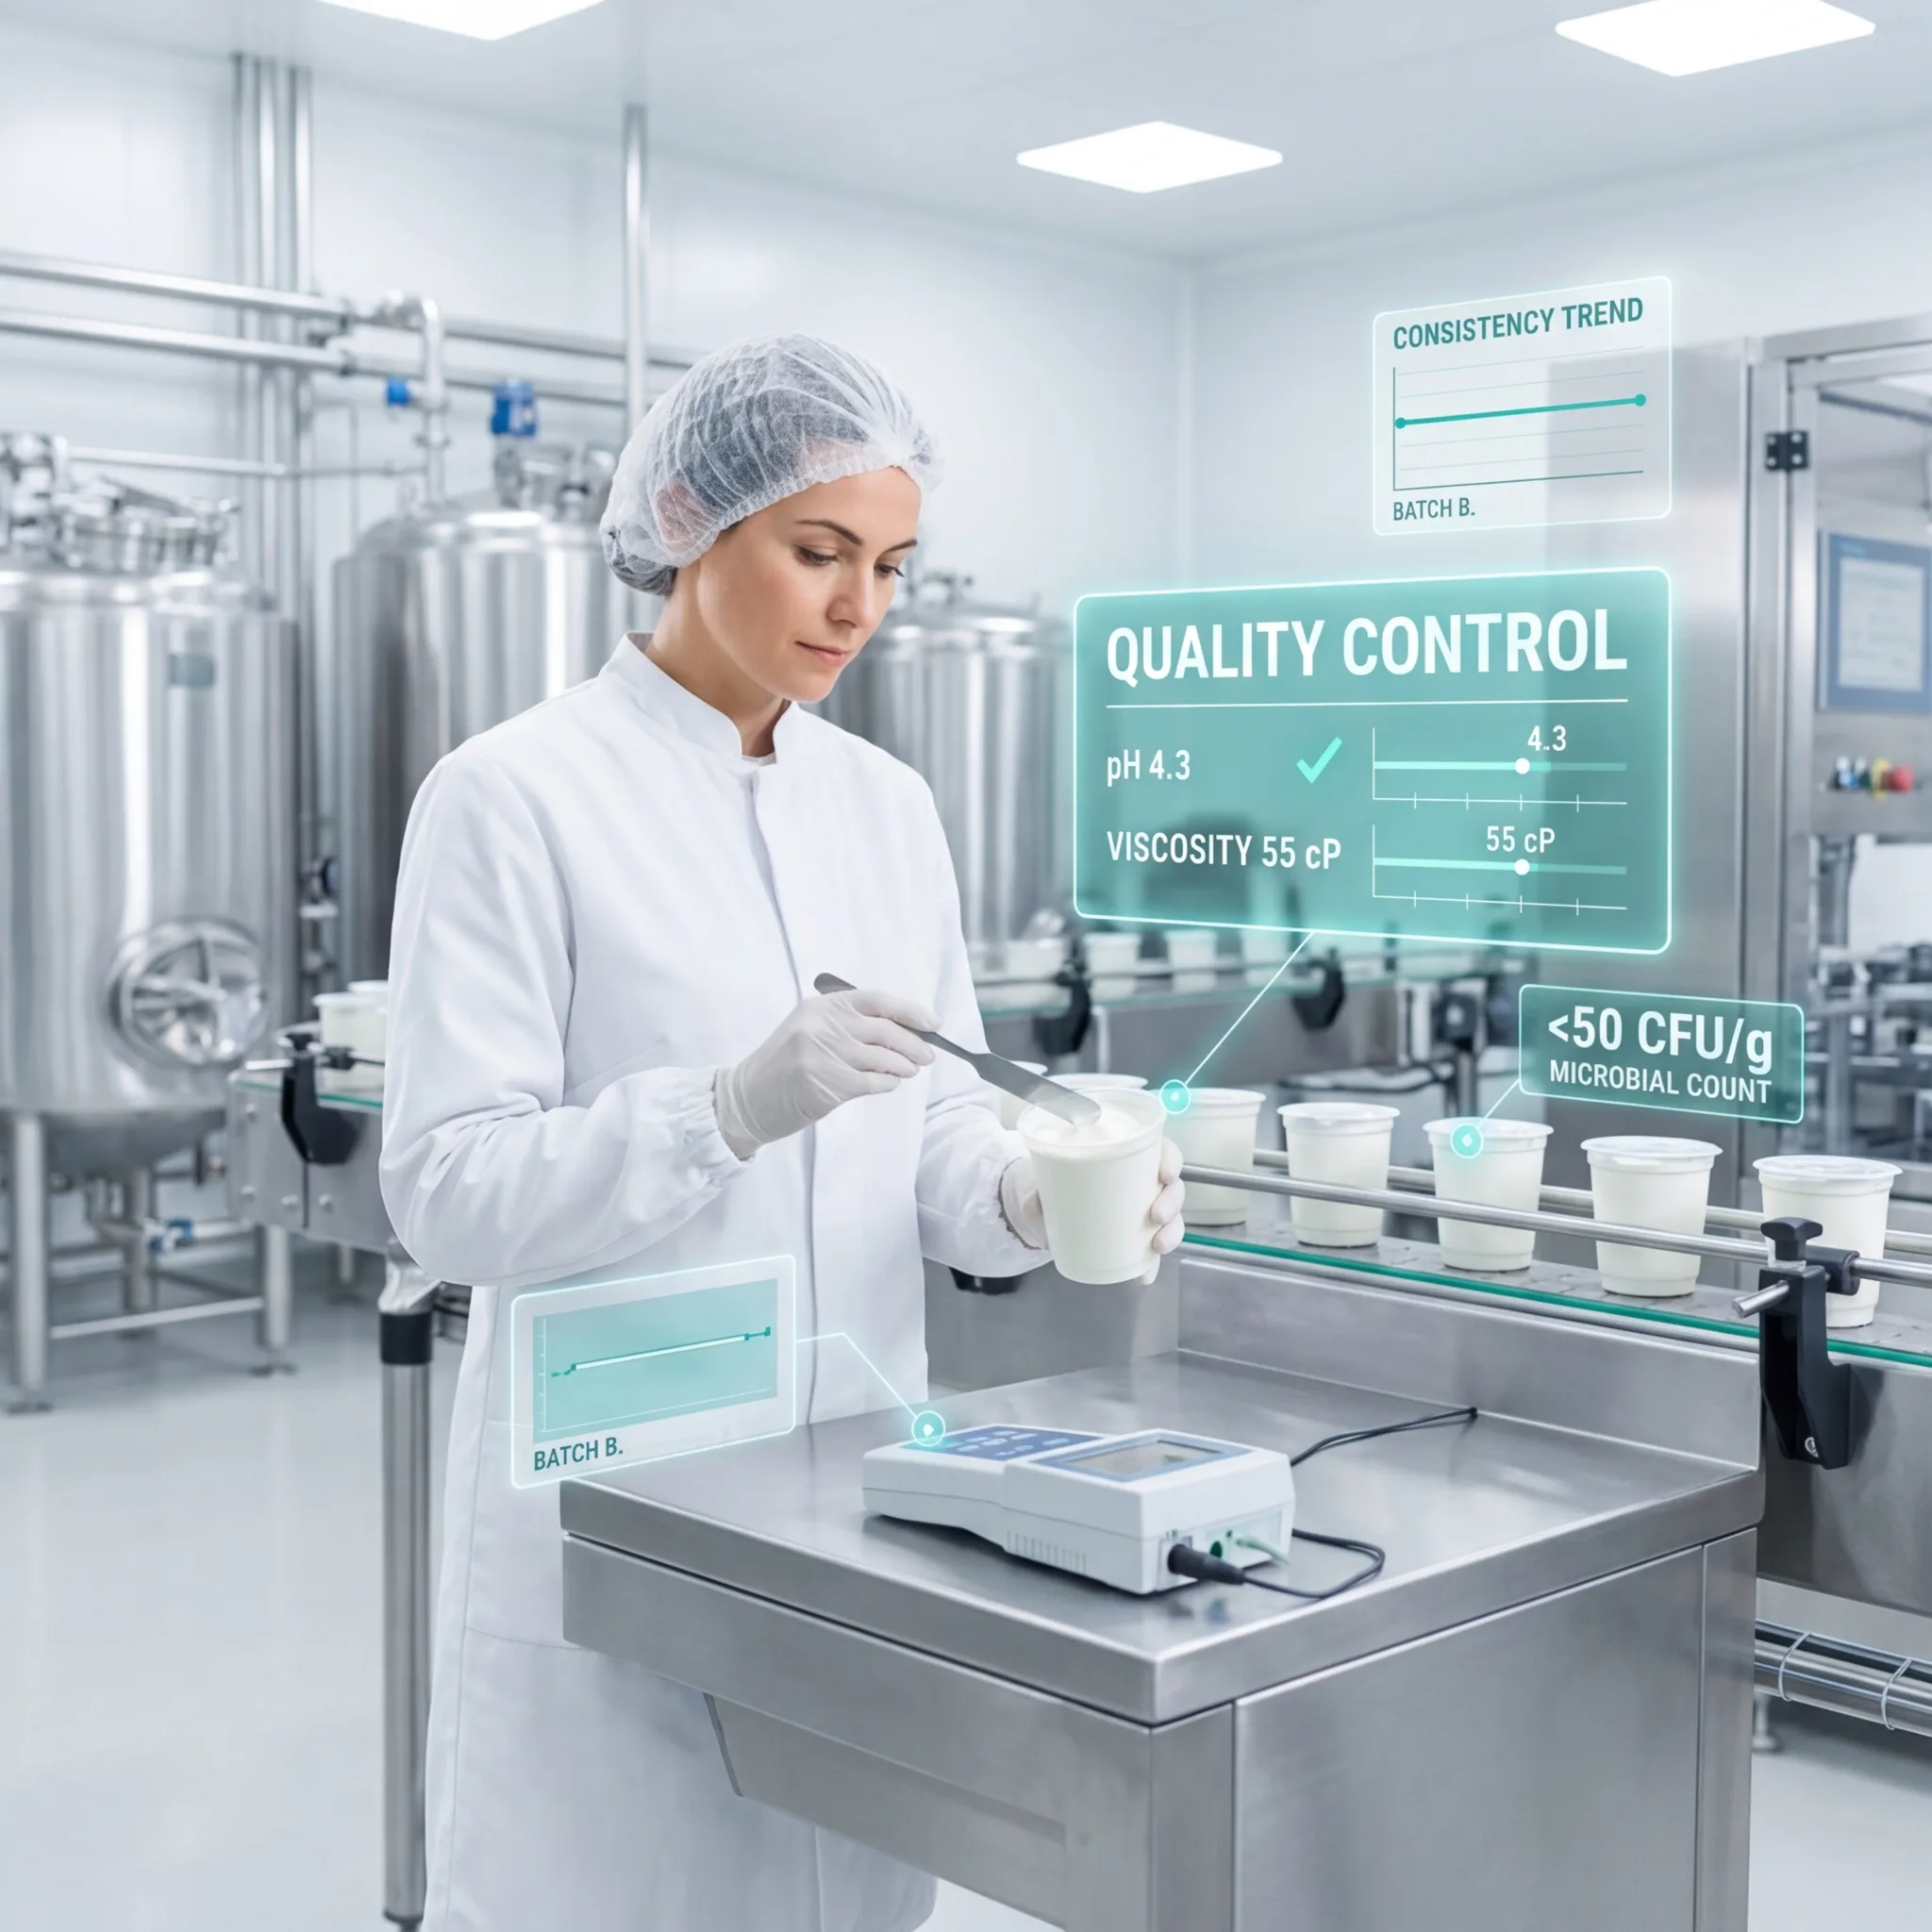
| Viscosity | Physical | Viscometer reading | 50-60 cP (typical) |
| pH | Chemical | pH meter | 4.0-4.6 |
| Microbial Count | Biological | Colony forming units (CFU) | under 50 CFU/g |
| Color | Visual | Spectrophotometer | White/off-white |
Quality Control Process
In-Process Quality Control (During Production):
Raw Material Inspection:
- Incoming milk: Temperature under 40 degrees F, bacterial count under 10,000 CFU/mL
- Additives: Certificate of analysis from supplier
- Decision: Accept or reject
Production Monitoring:
- Fermentation: Check pH every 2 hours (target 4.0-4.6)
- Incubation temperature: Monitor continuously
- Time: Verify fermentation complete per protocol
- Decision: Continue or extend fermentation
Pre-Packaging Inspection:
- Sample 10% of batches
- Test: Viscosity, pH, microbial count
- Sensory evaluation: Taste, smell, texture
- Decision: Release or hold for further testing
Finished Product Testing (After Packaging):
Daily Testing:
- Samples from each production run
- Microbial count: under 50 CFU/g
- pH: 4.0-4.6
- Sensory: Taste/texture evaluation
- Decision: Ship or quarantine
Weekly Testing:
- Shelf-life samples (stored at 4 degrees C)
- Test at 1 day, 7 days, 14 days
- Verify product stable throughout shelf life
- Decision: Adjust shelf life if needed
Statistical Process Control (SPC)
Monitor consistency over time:
Control Chart:
- Plot quality metric (viscosity) for each batch
- Upper control limit (UCL): +3 standard deviations
- Lower control limit (LCL): -3 standard deviations
- Center line: Process target
Interpretation:
- Within limits: Process stable, continue
- Outside limits: Process out of control, investigate
- Trend toward limit: Early warning, preventive action
Root Cause Analysis for Variation
When product varies from standard:
Step 1: Identify Variation
- "Batch 456 viscosity 45 cP (target 50-60)"
Step 2: Investigate Root Cause
- Fermentation time short?
- Temperature deviation?
- Ingredient batch issue?
- Equipment malfunction?
Step 3: Corrective Action
- Extend fermentation time? Adjust temperature? Change ingredient supplier? Repair equipment?
Step 4: Verify Correction
- Test next batch
- Confirm parameter back in spec
- Document for traceability
Cost of Inconsistency
Scenario: 5% of batches out of spec
Direct Cost:
- Rework/scrap: 5% x $50K daily production = $2.5K daily
- Annual cost: $900K
Indirect Cost:
- Customer dissatisfaction: Lost repeat purchases
- Brand damage: Reduced new customer acquisition
- Regulatory: Inspection findings if patterns develop
Total annual impact: $2M+
Consistency Building Program
Phase 1: Standardize Processes
- Document procedures precisely
- Train all operators same method
- Verify compliance
Phase 2: Establish Standards
- Define quality parameters
- Set acceptance limits
- Create testing protocols
Phase 3: Monitor Continuously
- Daily testing
- Chart results
- Identify trends
Phase 4: Continuous Improvement
- Root cause analysis of deviations
- Corrective actions
- Process refinement
For food manufacturing companies, systematic quality control and consistency programs build customer trust and competitive advantage through reliable product standards.