A beverage manufacturer produces turbid juice without filtration. Result: Unacceptable clarity. Customer rejects product. Lost sales and reputation damage.
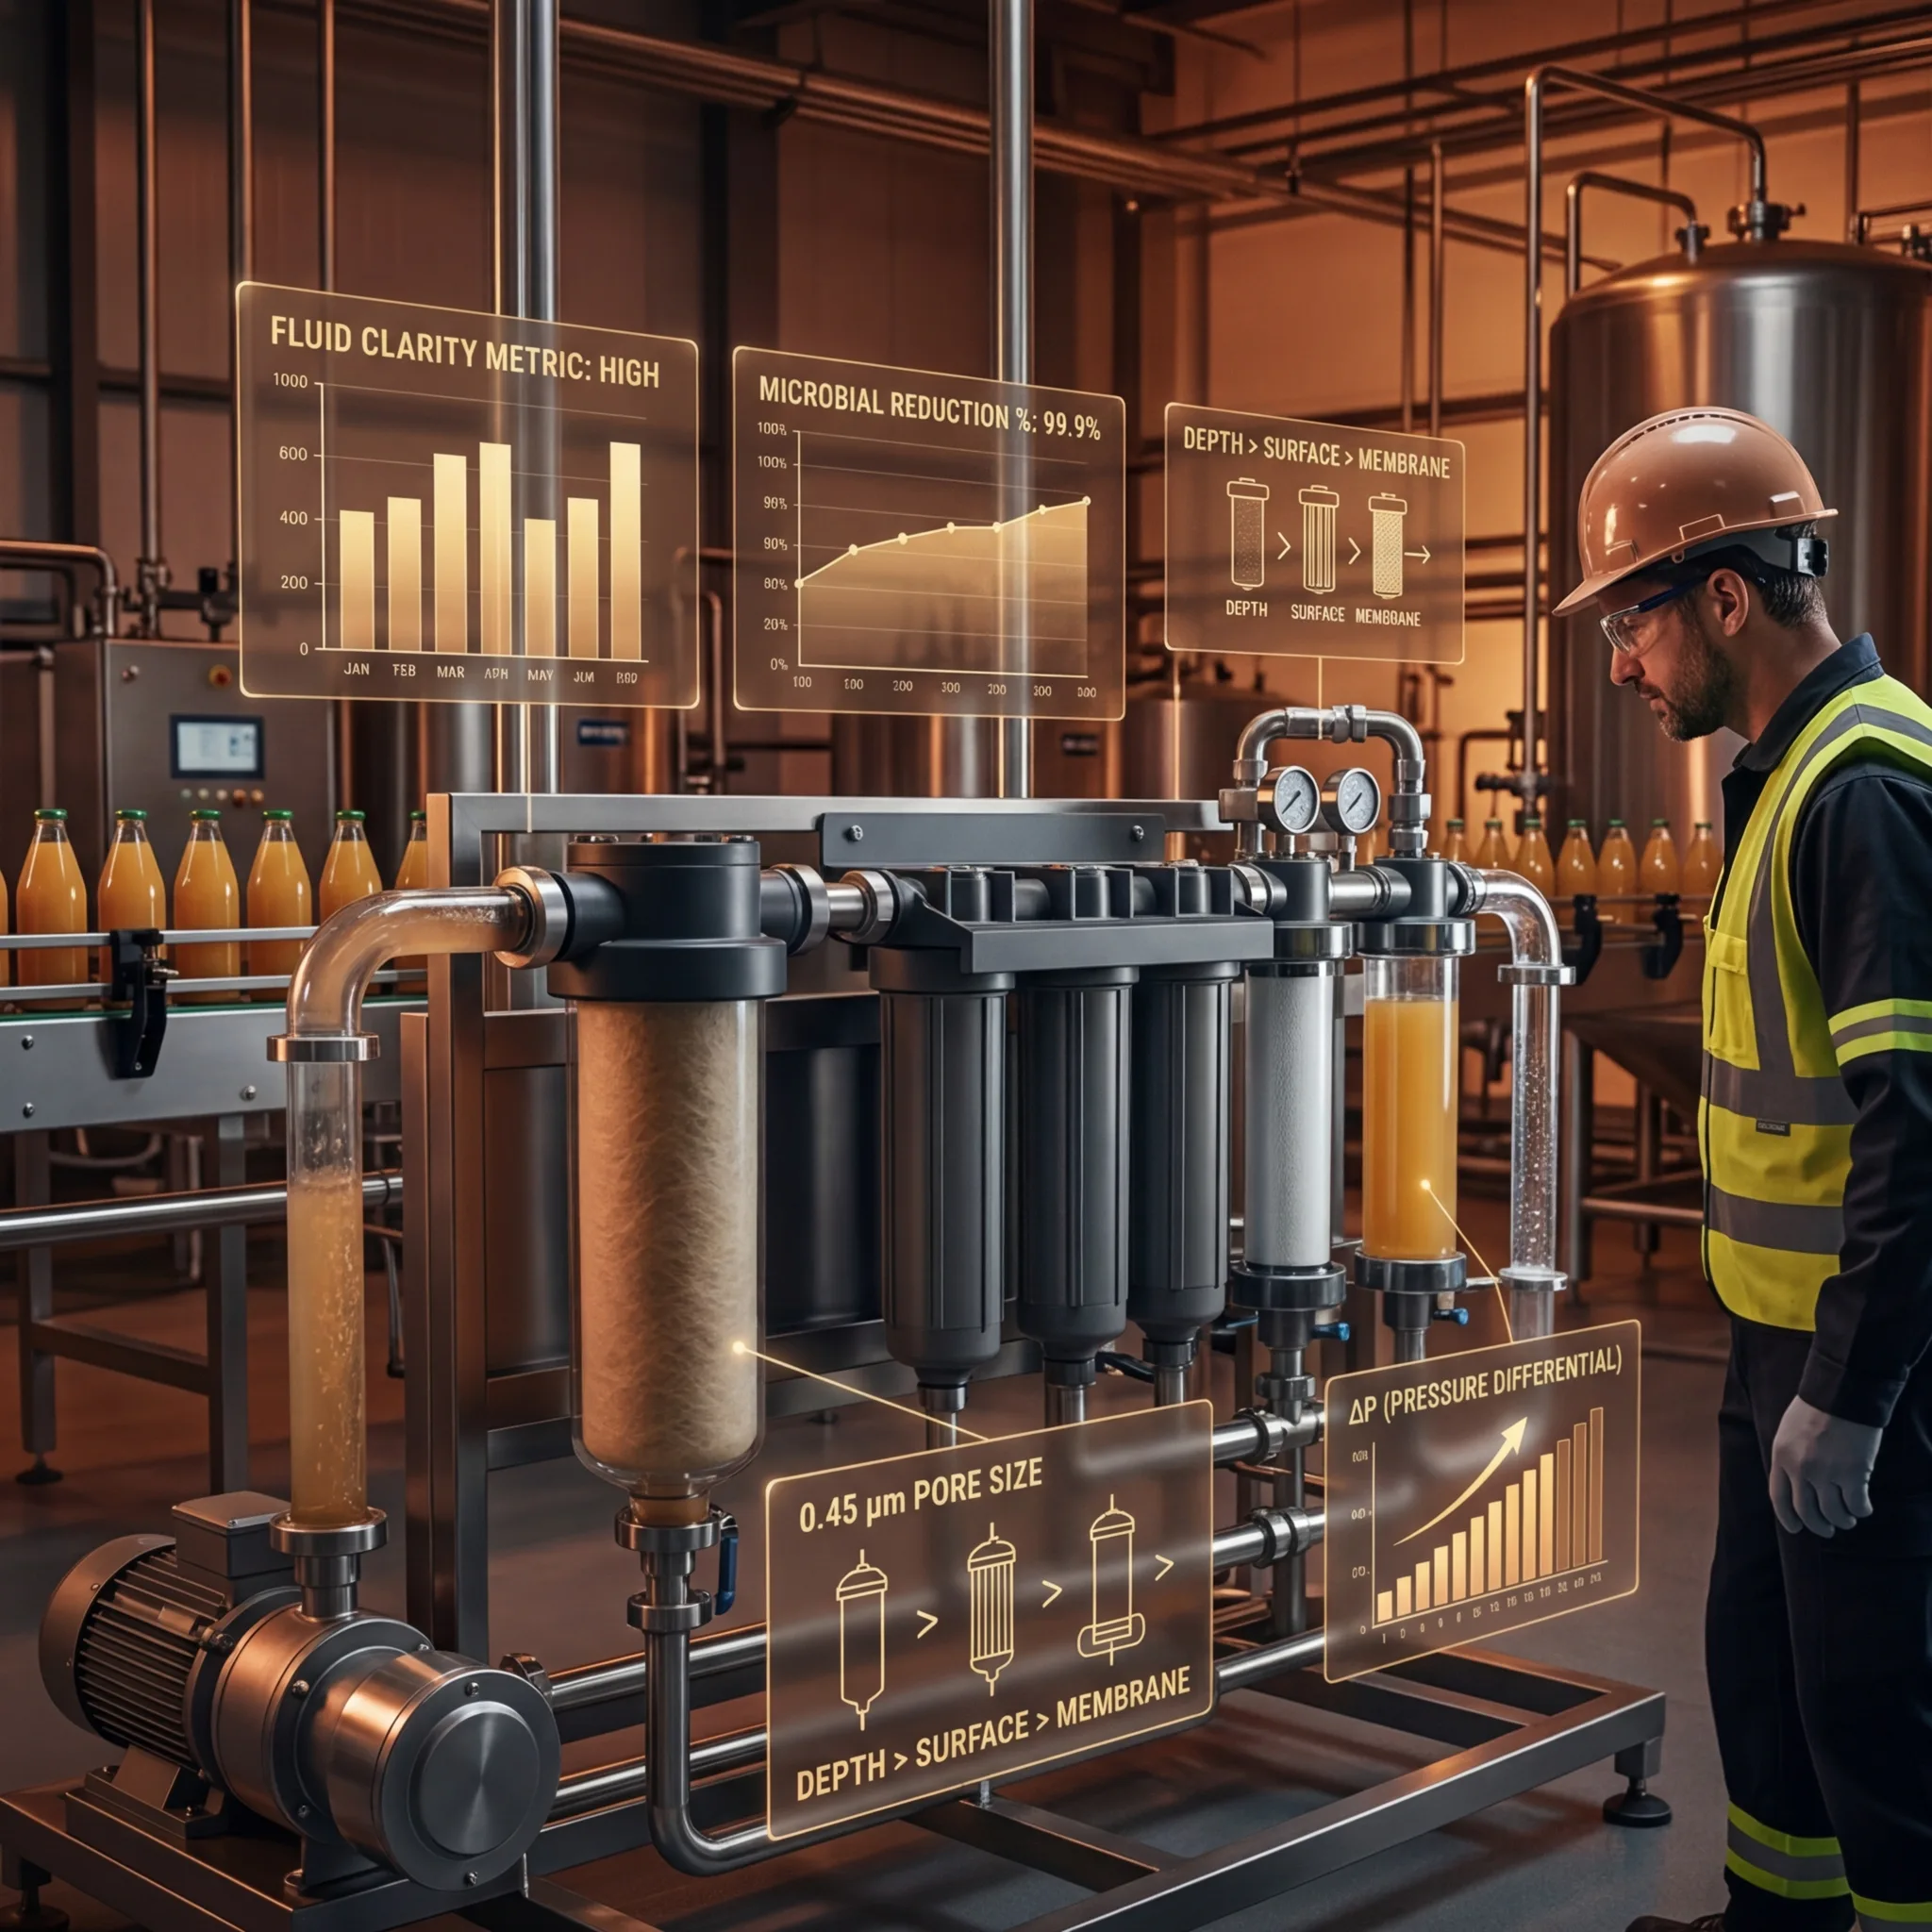
A compliant manufacturer selects multi-stage filtration: pre-filter (20 um), polishing filter (5 um), then membrane (0.45 um). Achieves crystal clarity. Customer satisfaction increases. Market premium pricing justified.
Filtration system design directly impacts product clarity, shelf-life, and customer acceptance.
The Filtration Framework
Filtration Principle: Size Exclusion
Particles larger than filter pore size are physically blocked. Smaller particles pass through.
Key Parameters:
- Pore Size: um (microns) = filter selectivity
- Pressure Differential: Bar or psi = driving force
- Flow Rate: L/min = throughput
- Particle Size: um = target removal
Relationship: Pressure = Flow x Resistance (modified Darcy's Law)
As filter loads with particles, resistance increases, pressure rises, and flow decreases.
Filtration Types
Depth Filtration (Pre-filtration):
Design: Thick porous media (fiberglass, cellulose) traps particles throughout depth
Application: Pre-filtration, 10-100 um pore size
- Throughput: Moderate (high flow possible due to depth)
- Loading capacity: High (holds significant particle mass)
- Particle removal: Moderate efficiency (~90%)
- Cost: Low
- Maintenance: Replace filter cartridge when pressure drops excessive
Surface Filtration (Final Filtration):
Design: Thin membrane with defined pore size, particles blocked at surface
Application: Polishing, 0.1-5 um pore size
- Throughput: Lower (high resistance)
- Loading capacity: Lower (surface only)
- Particle removal: High efficiency (over 99.9%)
- Cost: Moderate
- Maintenance: Replace more frequently due to loading
Membrane Filtration (Advanced):
Four types by pore size:
| Type | Pore Size | Pressure | Removal | Application |
|---|---|---|---|---|
| Microfiltration (MF) | 0.1-10 um | 1-3 bar | Particles, bacteria | Pre-treatment for RO |
| Ultrafiltration (UF) | 0.01-0.1 um | 2-5 bar | Proteins, viruses | Whey concentration |
| Nanofiltration (NF) | 0.001-0.01 um | 5-20 bar | Salts, small molecules | Desalination |
| Reverse Osmosis (RO) | under 0.001 um | 10-60 bar | Dissolved ions | Ultra-pure water |
Multi-Stage Filtration Design
Typical Juice Processing:
Stage 1: Pre-filtration (20 um depth filter)
- Input: Turbid juice (particles 10-500 um)
- Output: Coarse filtered (particles 5-20 um removed)
- Time: Continuous
- Pressure: 0.5-1.5 bar
- Benefit: Protects downstream filters from loading
Stage 2: Polishing (5 um surface filter)
- Input: Coarse filtered juice
- Output: Clear juice (particles 1-5 um)
- Time: Continuous
- Pressure: 1-3 bar
- Benefit: Improves clarity, extends RO life
Stage 3: Membrane (0.45 um ultrafiltration)
- Input: Polished juice
- Output: Crystal clear, reduced microbes (5-log reduction possible)
- Time: Continuous
- Pressure: 2-5 bar
- Benefit: Final polishing, microbial reduction
Overall Performance:
- Particle removal: 1 ppm to 0.001 ppm (1,000-fold improvement)
- Microbial reduction: 99.99%+ (sterile filtration)
Filtration Efficiency Measurement
Beta Ratio:
Beta = (Particles upstream size X) / (Particles downstream size X)
Example: Beta-10 = 200 means:
- 200 particles at or above 10 um entering filter
- 1 particle at or above 10 um exiting filter
- Removal efficiency: 99.5%
Target specifications:
- Pre-filter: Beta-20 over 1,000
- Polish filter: Beta-5 over 1,000
- Membrane: Beta-0.45 over 10,000 (over 99.99% removal)
Operational Considerations
Pressure Management:
Initial pressure: 1-2 bar (clean filter) Final pressure: 3-5 bar (loaded filter) Changeout trigger: When delta-P reaches 3.5 bar
Monitoring: Install pressure gauges pre and post-filter
Bypass Systems:
- Purpose: Protect equipment if filter clogs unexpectedly
- Function: Releases pressure, maintains flow (at cost of filtration efficiency)
- Safety valve setting: 0.5 bar above normal operation
Flow vs. Pressure Trade-off:
| Filter Type | Max Flow | Pressure | Time Until Replace |
|---|---|---|---|
| 20 um depth | High (50 L/min) | Low (1 bar) | Long (weeks) |
| 5 um polish | Moderate (20 L/min) | Medium (2 bar) | Medium (days) |
| 0.45 um UF | Lower (10 L/min) | High (5 bar) | Short (hours) |
Cost-Benefit Analysis
| Filter Stage | Filter Cost | Pressure Drop | Lifespan | Cost/L Processed |
|---|---|---|---|---|
| Pre-filter | $50 | Low | 100,000 L | $0.0005 |
| Polish filter | $100 | Moderate | 10,000 L | $0.01 |
| Membrane | $500 | High | 1,000 L | $0.50 |
| Multi-stage total | $650 | -- | -- | $0.511/L |
For food manufacturing companies, proper filtration system design ensures product clarity, extends equipment life, and improves customer satisfaction.