Utilities (electricity, natural gas, water) typically represent 8-12% of food manufacturing operating cost. For a $50M revenue facility, that's $4-6M annually.
A 10% efficiency improvement saves $400K-$600K annually—directly improving EBITDA.
Yet many facilities approach utility management reactively (pay the bills) rather than strategically. Progressive manufacturers track energy intensity metrics and pursue systematic improvements.
The Energy Intensity Framework
Food manufacturing utilities break down roughly:
Steam Production (40% of energy):
- Boiler operation for CIP, heating, sterilization
- Measured in: Pounds of steam per unit produced
- Industry benchmark: 3-5 lbs steam per unit (highly product-dependent)
Refrigeration (25% of energy):
- Cooling for storage, process
- Measured in: Cooling capacity per refrigeration tonnage
- Industry benchmark: 0.8-1.2 kW per ton of cooling
Compressed Air (15% of energy):
- Pneumatic tools, controls, automation
- Measured in: CFM (cubic feet/minute) per horsepower
- Industry benchmark: 3-4 CFM per HP (often unmonitored waste)
Facility HVAC/Lighting (15% of energy):
- Building heating, cooling, lighting
- Measured in: kWh per square foot per year
- Industry benchmark: 3-5 kWh/sq ft (varies by climate)
Quick Win Opportunities (0-6 Months, Under $50K Investment)
Compressed Air Audit:
- Typical finding: 20-30% leakage in distribution
- Action: Locate and repair leaks
- Savings: 5-8% energy reduction
- Cost: $5K
Boiler Optimization:
- Typical finding: 3-5% efficiency loss from scale buildup
- Action: Annual descaling service
- Savings: 3-5% energy reduction
- Cost: $3K
HVAC Recommissioning:
- Typical finding: HVAC running continuously; thermostat setpoints suboptimal
- Action: Optimize schedules, setpoints, controls
- Savings: 10-15% facility energy
- Cost: $10K
Lighting Upgrade:
- Replace inefficient fixtures with LED
- Savings: 50-60% lighting energy
- Cost: $30K (often eligible for rebates reducing net cost to $10-15K)
Strategic Projects (6-24 Months, $100K-$500K Investment)
Steam System Upgrade:
- Replace inefficient boiler or optimize steam distribution
- Savings: 15-20% steam energy
- Cost: $200K-$400K
- Payback: 2-3 years
Refrigeration System Modernization:
- Replace aging refrigeration with modern, efficient equipment
- Savings: 20-30% refrigeration energy
- Cost: $300K-$600K
- Payback: 3-5 years
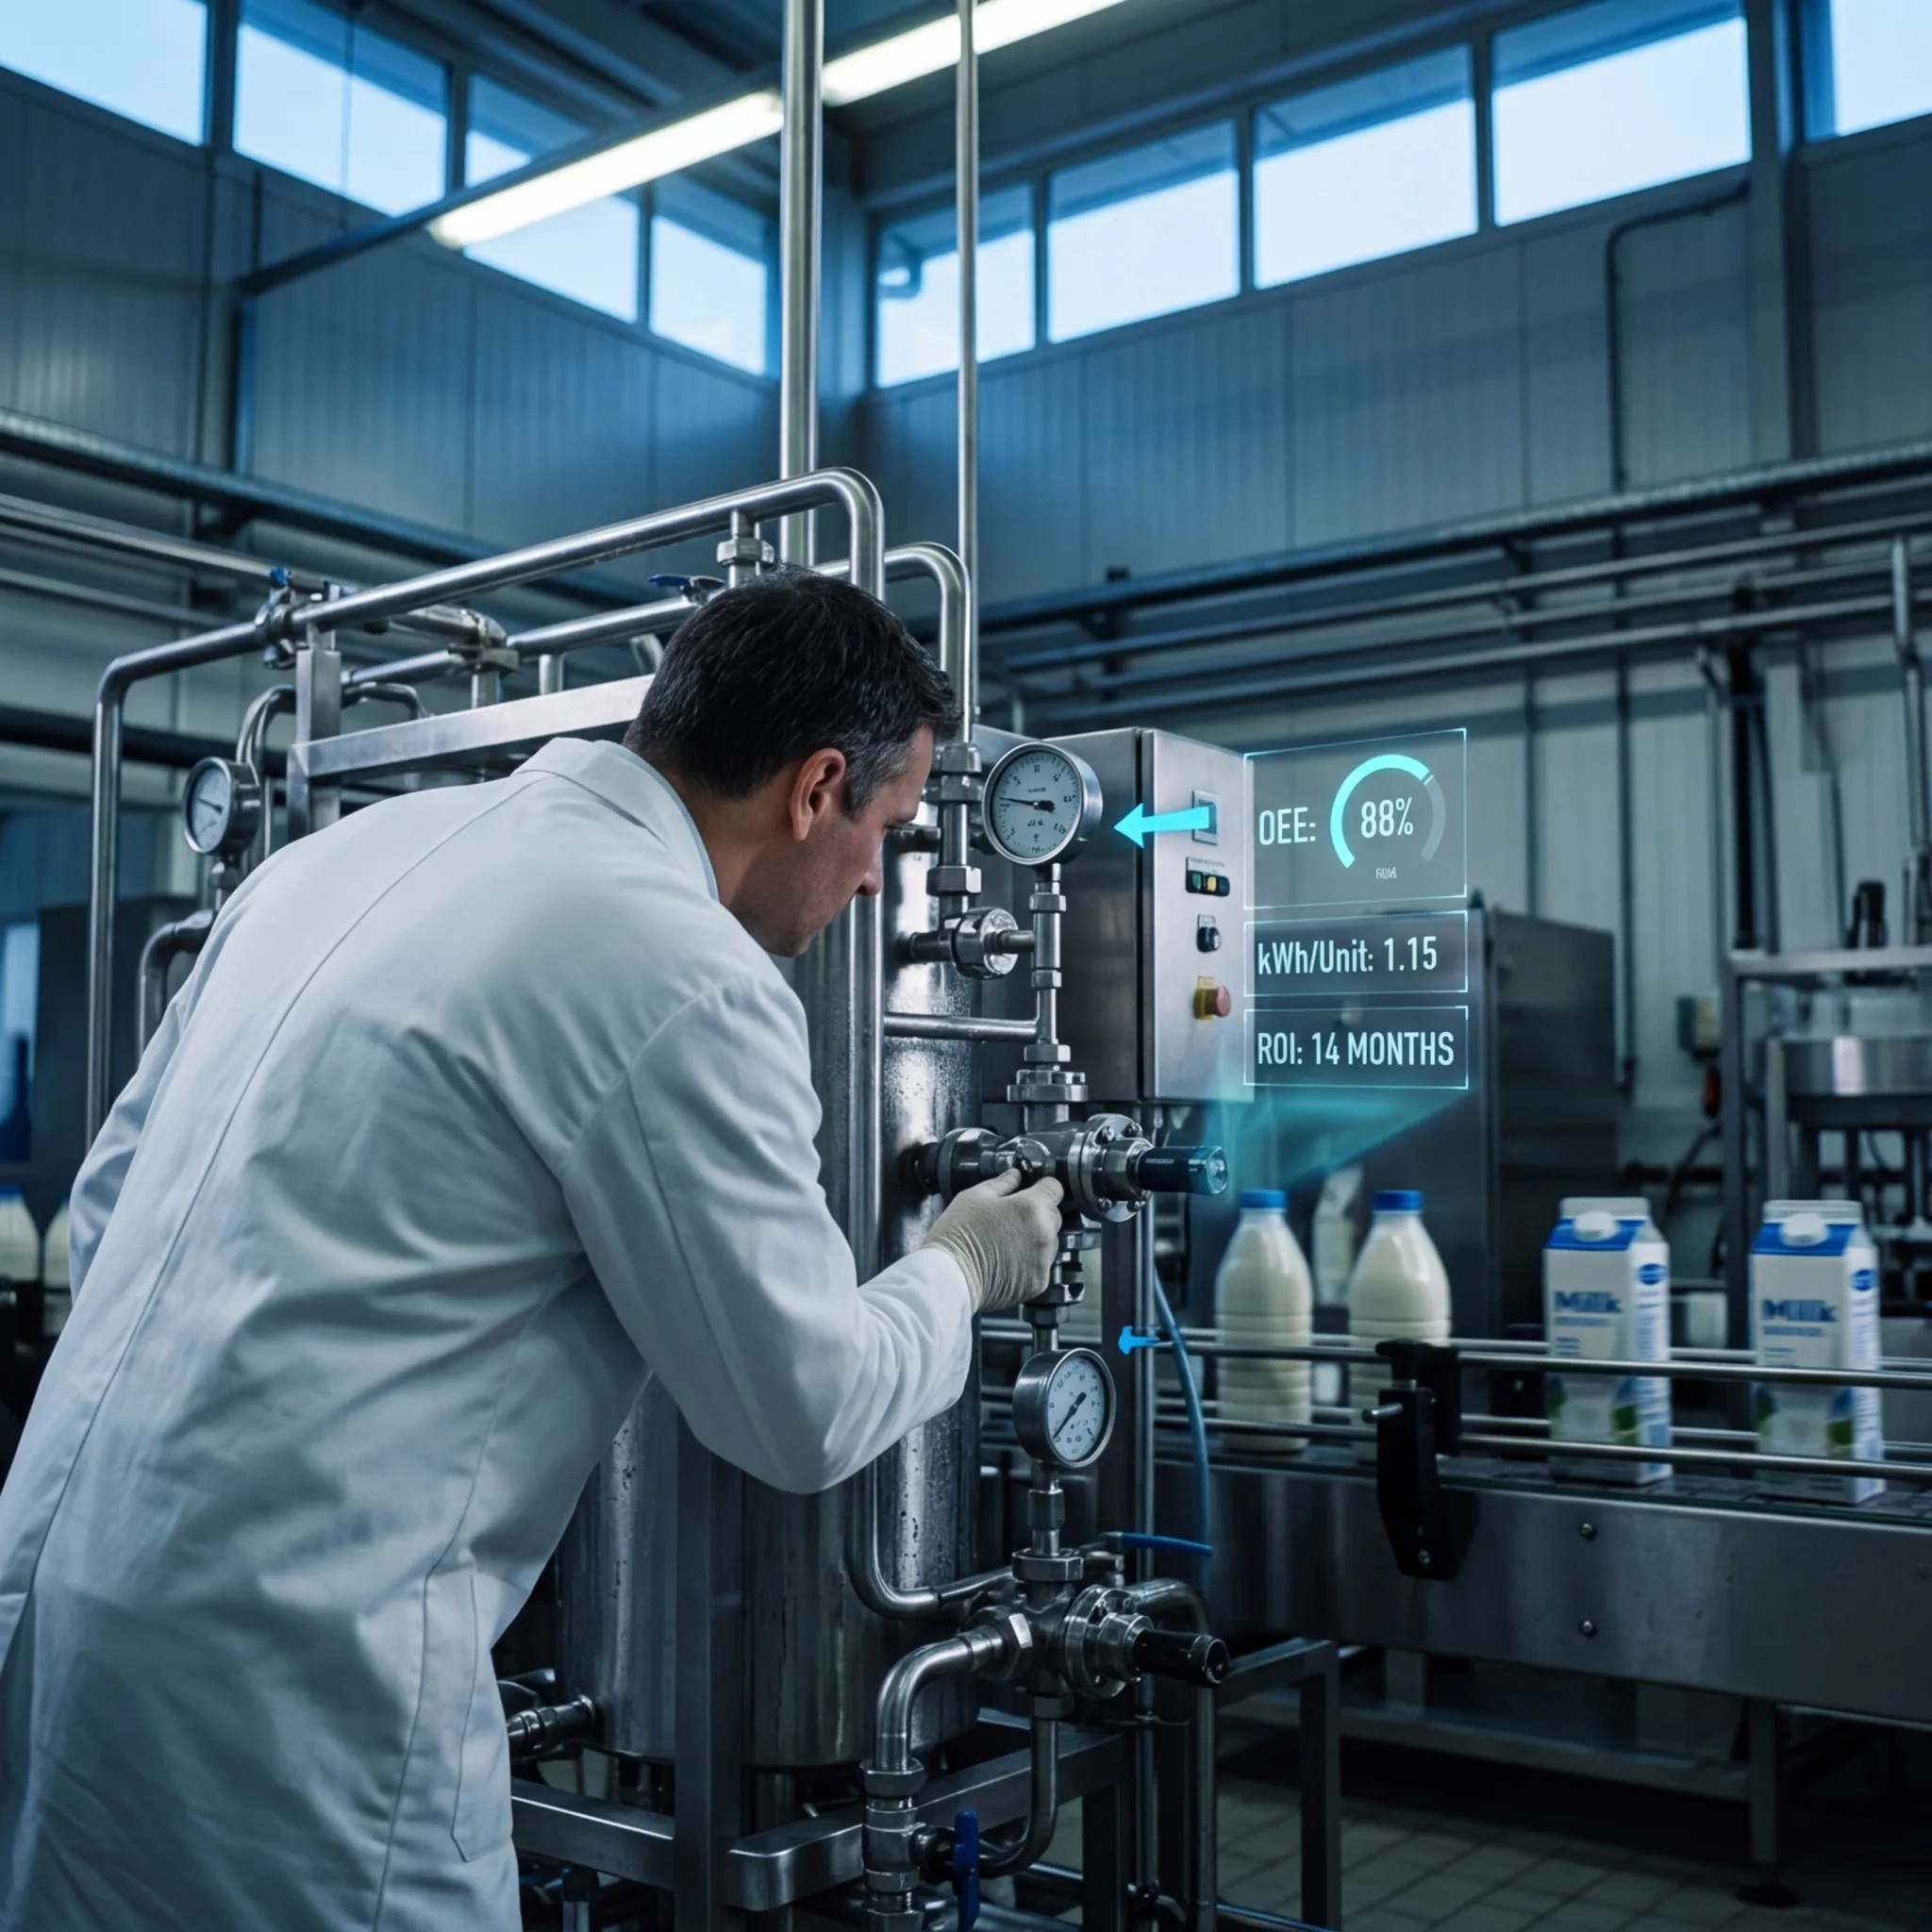
The Energy Monitoring Foundation
Systematic energy efficiency requires baseline measurement:
- Sub-meter key systems (steam, refrigeration, compressed air)
- Monthly tracking of energy intensity (kWh per unit)
- Annual energy audit identifying improvement opportunities
- Quarterly reporting to management
Most facilities implementing energy management achieve 10-15% efficiency improvement within 12 months through combination of quick wins and strategic projects.
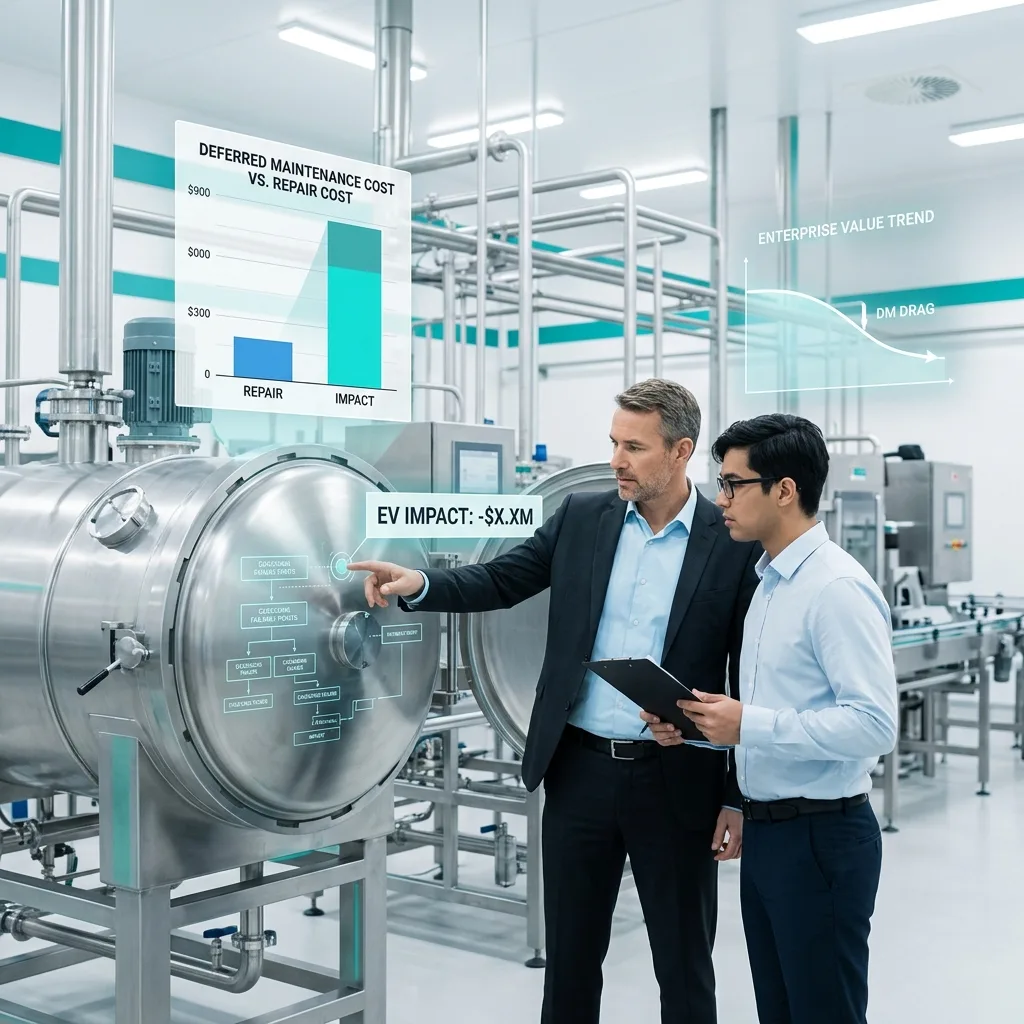
The PE Value Creation Angle
PE investors increasingly value energy efficiency as operational leverage. A facility with visible energy efficiency program and recent improvements commands premium valuations.
For food manufacturing companies, systematic energy management programs identify cost reduction opportunities while positioning operations for climate regulations and investor expectations around sustainability.