A dairy processor uses natural gas boilers for pasteurization (massive energy consumption). Result: 50,000 tons CO2 annually, high energy costs ($2M/year), regulatory risk (carbon taxes emerging).
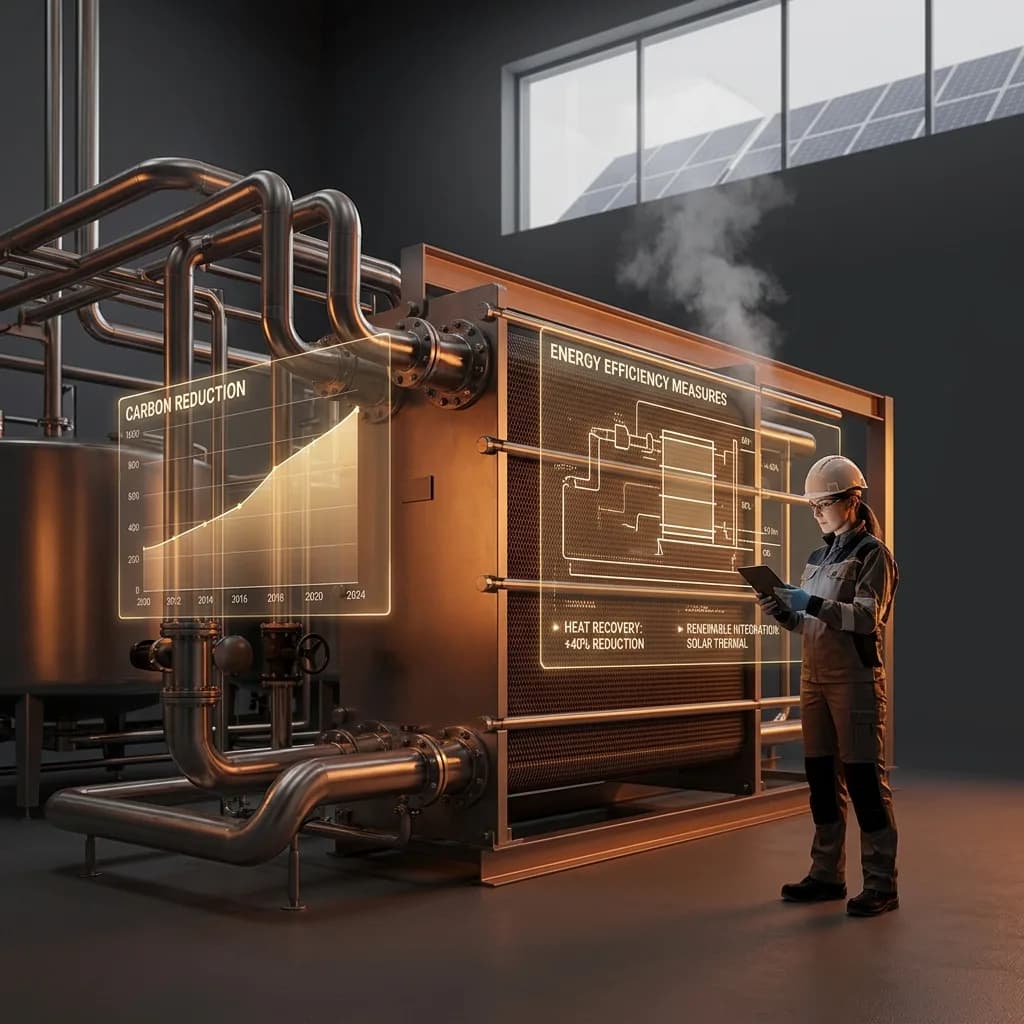
A sustainable facility installs heat recovery systems + solar thermal: Captures waste heat, preheats water with solar. Result: 40% energy reduction, 20,000 tons CO2 eliminated annually, $800K energy cost savings. Carbon-neutral positioning achieved.
Carbon reduction directly impacts operating costs and regulatory compliance.
The Carbon Reduction Framework
Food Manufacturing Energy Use:
Typical energy distribution:
- Thermal (heating/cooling): 60-70%
- Mechanical (motors, pumps): 20-25%
- Lighting/HVAC: 10-15%
Primary Carbon Sources:
| Source | Contribution | Reduction Strategy |
|---|---|---|
| Natural gas boilers | 40-50% | Heat recovery, efficiency |
| Electricity (grid) | 30-40% | Renewable energy, efficiency |
| Refrigeration | 15-20% | System optimization |
| Transportation | 5-10% | Route optimization, electric vehicles |
Energy Efficiency Measures
Strategy 1: Heat Recovery Systems
Technology: Plate heat exchangers
Process:
- Hot liquid exits pasteurizer (72 degrees C)
- Passes through heat exchanger
- Preheats incoming cold liquid (4 degrees C to 50 degrees C)
- Result: 60-70% energy recovered
Example (Dairy):
Without heat recovery:
- Heating requirement: 100 kW continuous
- Annual cost: $200K (natural gas)
- CO2 emissions: 2,000 tons/year
With heat recovery:
- Heating requirement: 40 kW (60% reduction)
- Annual cost: $80K
- CO2 reduction: 1,200 tons/year
- Payback: 2-3 years
Strategy 2: Variable Frequency Drives (VFDs)
Technology: Motor speed control
Application:
- Pumps: Reduce speed when full flow unnecessary
- Fans: Match airflow to actual demand
- Compressors: Optimize refrigeration load
Energy Savings:
- 20-40% motor energy reduction typical
- Payback: 1-2 years
Strategy 3: LED Lighting
Conversion:
- Traditional: Fluorescent, metal halide
- LED: 50-70% energy reduction
- Lifetime: 5-10x longer (maintenance savings)
- Payback: 6-18 months
Renewable Energy Integration
Option 1: Solar Thermal (Hot Water)
System:
- Solar collectors: Heat water/glycol fluid
- Storage tank: Maintain hot water supply
- Backup: Conventional boiler for cloudy days
Applications:
- Cleaning/sanitation (hot water demand)
- Blanching processes
- Preheating boiler feed water
Economics:
- System cost: $150-300K
- Energy savings: 30-50% hot water cost
- Payback: 4-7 years
Option 2: Solar Photovoltaic (Electricity)
System:
- Rooftop/ground-mount solar panels
- Inverter: Convert DC to AC power
- Grid connection: Sell excess or net meter
Economics (100 kW system):
- Cost: $200-300K installed
- Annual generation: 120-150 MWh
- Savings: $12-20K/year
- Payback: 10-15 years (with incentives: 7-10 years)
Option 3: Biogas from Organic Waste
Process:
- Anaerobic digestion: Convert organic waste to biogas
- Biogas: 50-70% methane (combustible)
- Use: Boiler fuel, electricity generation
Economics:
- Digester cost: $500K-2M
- Fuel savings: $100-300K/year
- Payback: 3-7 years (with waste disposal savings)
Carbon Accounting
Scope 1 (Direct Emissions):
- Natural gas boilers: Direct CO2 from combustion
- Calculation: Natural gas use x emission factor
- Example: 1 million BTU gas = 53 kg CO2
Scope 2 (Indirect Electricity):
- Grid electricity: CO2 from power plant
- Calculation: kWh x grid emission factor
- Varies by region (coal vs. renewables)
Scope 3 (Supply Chain):
- Ingredients, packaging, transportation
- Often largest footprint (60-80%)
- Harder to control directly
Carbon Reduction Targets
Typical Targets:
| Timeline | Reduction Target | Strategy |
|---|---|---|
| Near-term (2025) | 20-30% | Efficiency, heat recovery |
| Medium-term (2030) | 40-50% | + Renewables, process optimization |
| Long-term (2050) | 80-100% (net-zero) | + Carbon offsets, green hydrogen |
Cost-Benefit Analysis
| Measure | Cost | Savings/Year | Payback |
|---|---|---|---|
| Heat recovery | $100-300K | $50-150K | 2-3 years |
| VFDs | $30-80K | $20-40K | 1-2 years |
| LED lighting | $50-100K | $30-60K | 1-2 years |
| Solar thermal | $150-300K | $30-80K | 4-7 years |
| Solar PV | $200-300K | $15-25K | 10-15 years |
| Biogas digester | $500K-2M | $100-300K | 3-7 years |
For manufacturers, carbon reduction creates cost savings and regulatory resilience.