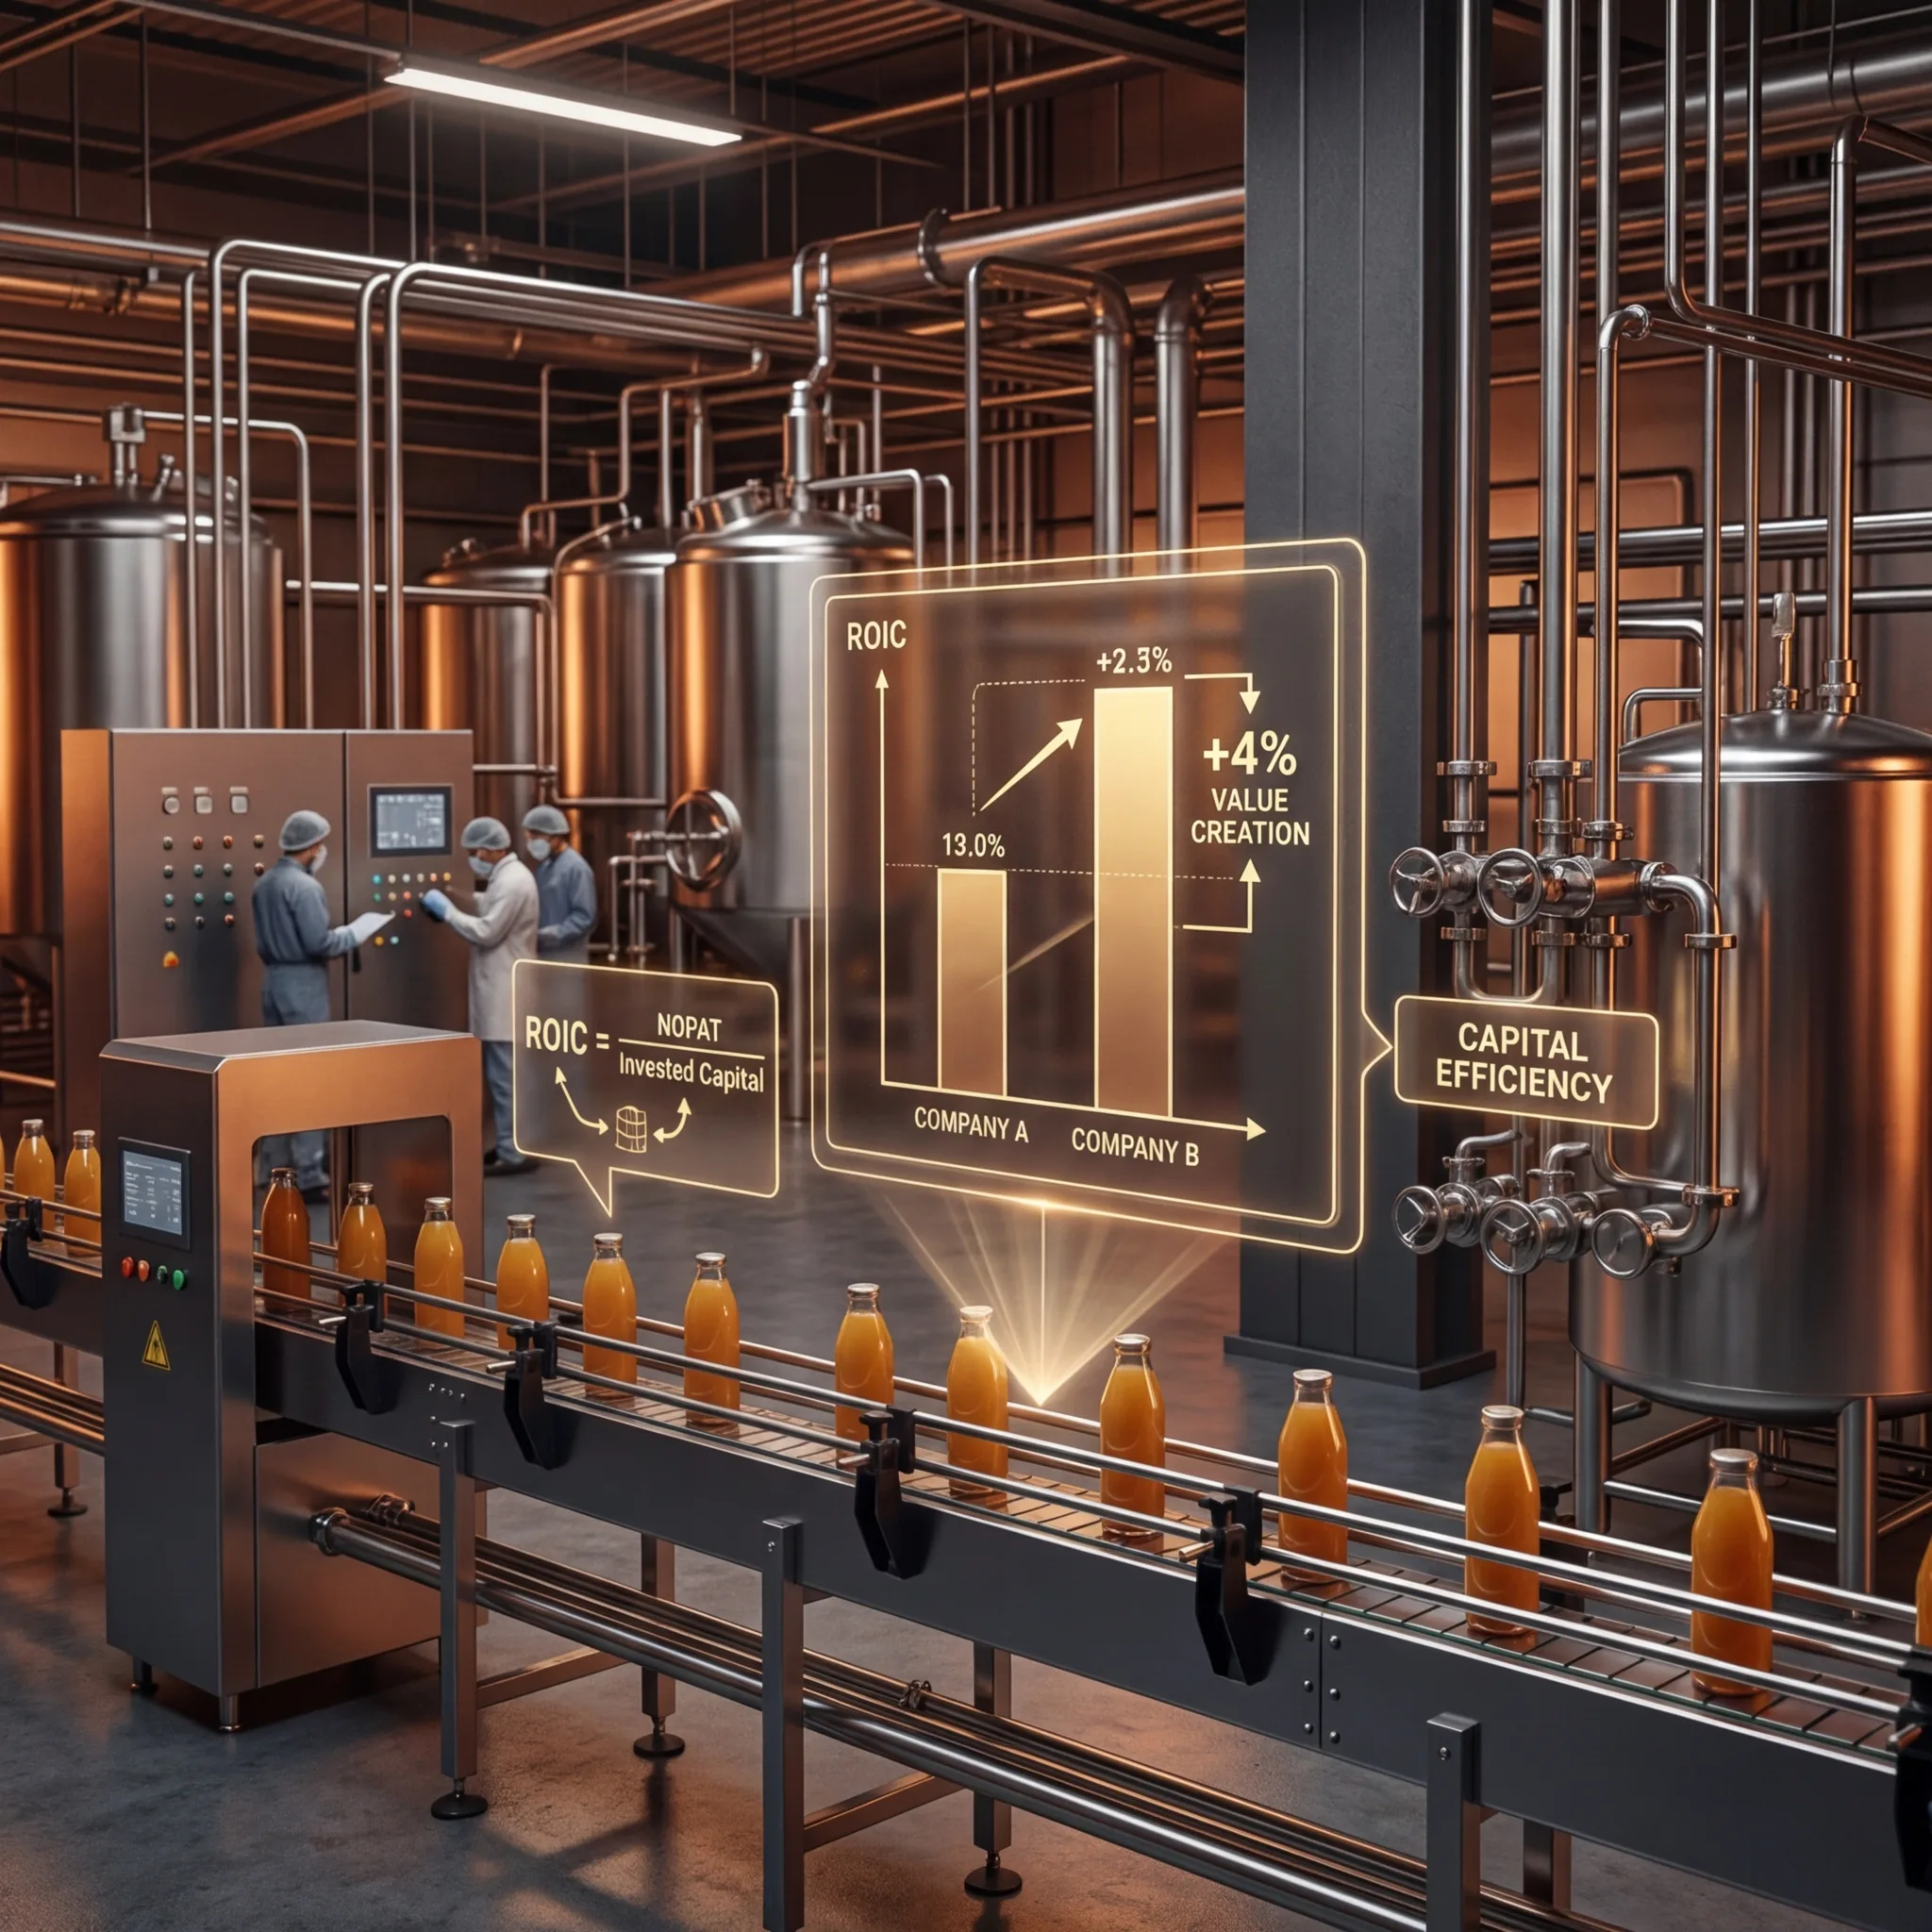
ROIC—Return on Invested Capital—measures how efficiently a company uses capital to generate profits.
Two food manufacturers each have $20M in invested capital (equity + debt).
Company A: $10M EBITDA with 8% ROIC Company B: $12M EBITDA with 12% ROIC
Company B creates more value from the same capital base. Over 10 years, this compounding difference is substantial.
ROIC is the most important metric for value creation and PE investor evaluation.
The ROIC Calculation
ROIC = NOPAT / Invested Capital
Where:
- NOPAT = Net Operating Profit After Tax
- Invested Capital = Total Assets - Current Liabilities (or Equity + Debt - Cash)
Example:
- EBITDA: $10M
- Depreciation: $1M
- EBIT (Operating Income): $9M
- Taxes (25%): $2.25M
- NOPAT: $6.75M
- Total Assets: $40M
- Current Liabilities: $5M
- Invested Capital: $35M
- ROIC: 6.75M / 35M = 19.3%
ROIC Benchmarking
| Company Type | Typical ROIC | High Performers |
|---|---|---|
| Asset-Heavy Manufacturing | 8-12% | 15%+ |
| Food Manufacturing | 10-15% | 18%+ |
| Capital-Light Services | 15-25% | 30%+ |
Food manufacturers typically generate 10-15% ROIC due to significant asset requirements (facilities, equipment).
ROIC Drivers
ROIC improves through:
-
Margin Improvement (NOPAT increase):
- Gross margin: +2% = $1M additional NOPAT
- SG&A reduction: +2% = $1M additional NOPAT
- Combined: +4% margin = $4M additional NOPAT
- ROIC impact: 19.3% to 31.8% (assuming same capital)
-
Capital Efficiency (Invested Capital reduction):
- Working capital improvement: -$2M
- Asset utilization: Increase revenue on same asset base
- Capital impact: -$2M capital = higher ROIC
-
Growth with Capital Efficiency:
- Revenue growth: 10% = $5M additional revenue
- NOPAT: +$1M (20% of incremental revenue at improved margin)
- Invested capital: +$2M (to support growth)
- Net ROIC: Increases if incremental ROIC exceeds cost of capital
ROIC and Valuation
PE investors use ROIC as proxy for management quality and capital allocation:
High ROIC Implications:
- Management allocates capital efficiently
- Competitive advantages exist (premium pricing, operational excellence)
- Value creation probable
- Premium valuation justified
Low ROIC Implications:
- Capital deployment challenges
- Possible competitive weakness
- Value destruction risk
- Lower valuation multiple
A food manufacturer with 10% ROIC typically valued at 4-5x EBITDA A food manufacturer with 18% ROIC typically valued at 6-7x EBITDA
The ROIC difference supports a 20-40% valuation premium.
Improving ROIC to 18%+
From 10% baseline:
- Margin improvement: +4% (SG&A reduction, gross margin lift) = +$4M NOPAT
- Capital efficiency: -$2M invested capital (working capital optimization)
- Revenue growth: +10% ($5M) at 30% incremental margin = +$1.5M NOPAT
- New ROIC: $12.25M / $33M = 37% (substantial improvement)
Realistic targets:
- Year 1: Improve to 12% ROIC (margin + efficiency)
- Year 2-3: Improve to 15% ROIC (growth + capital efficiency)
- Year 3+: Sustain 15-18% ROIC
The PE Value Creation Strategy
Most PE value creation (50%+) comes from ROIC improvement:
- Entry ROIC: 10%
- Target exit ROIC: 15-18%
- ROIC improvement drives valuation multiple expansion
- Higher multiple + higher EBITDA = 3-4x equity multiple target
For food manufacturing companies, improving ROIC through operational excellence and capital efficiency is the primary driver of long-term value creation.