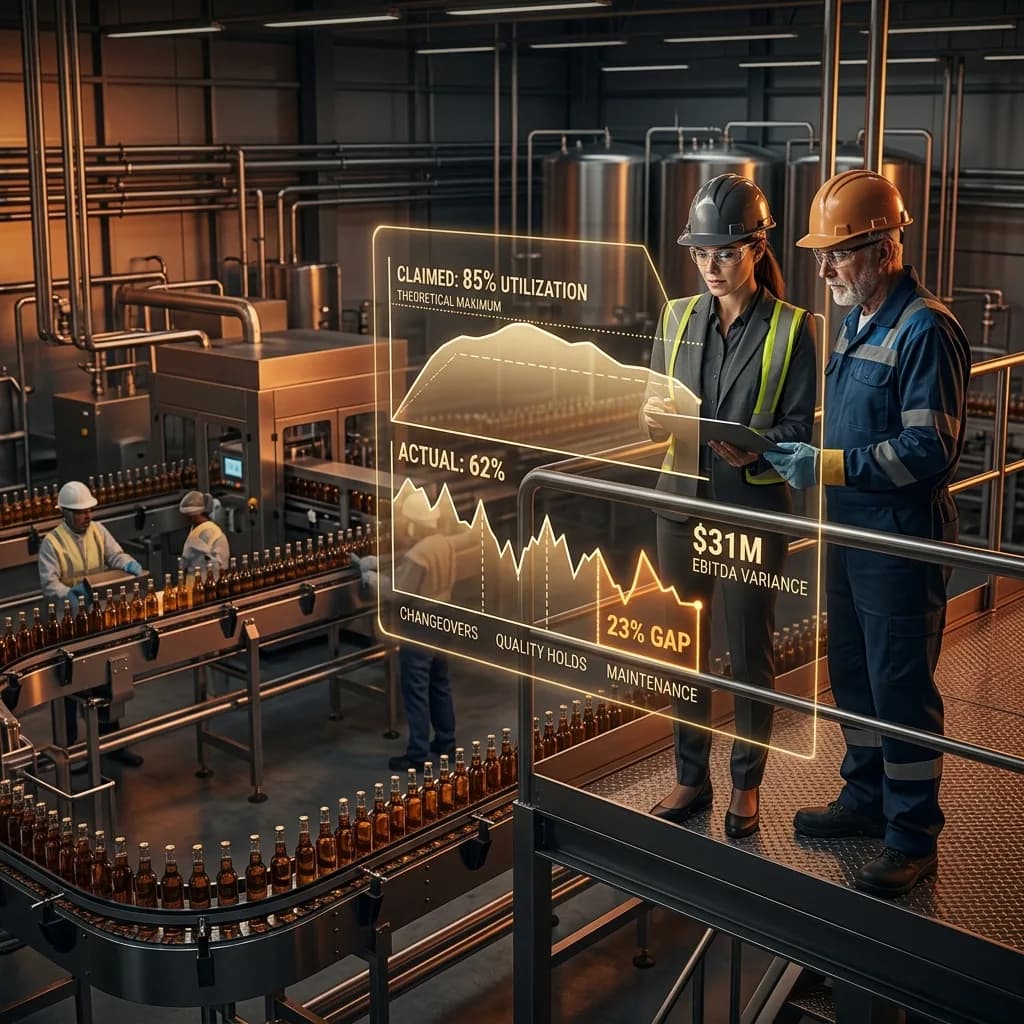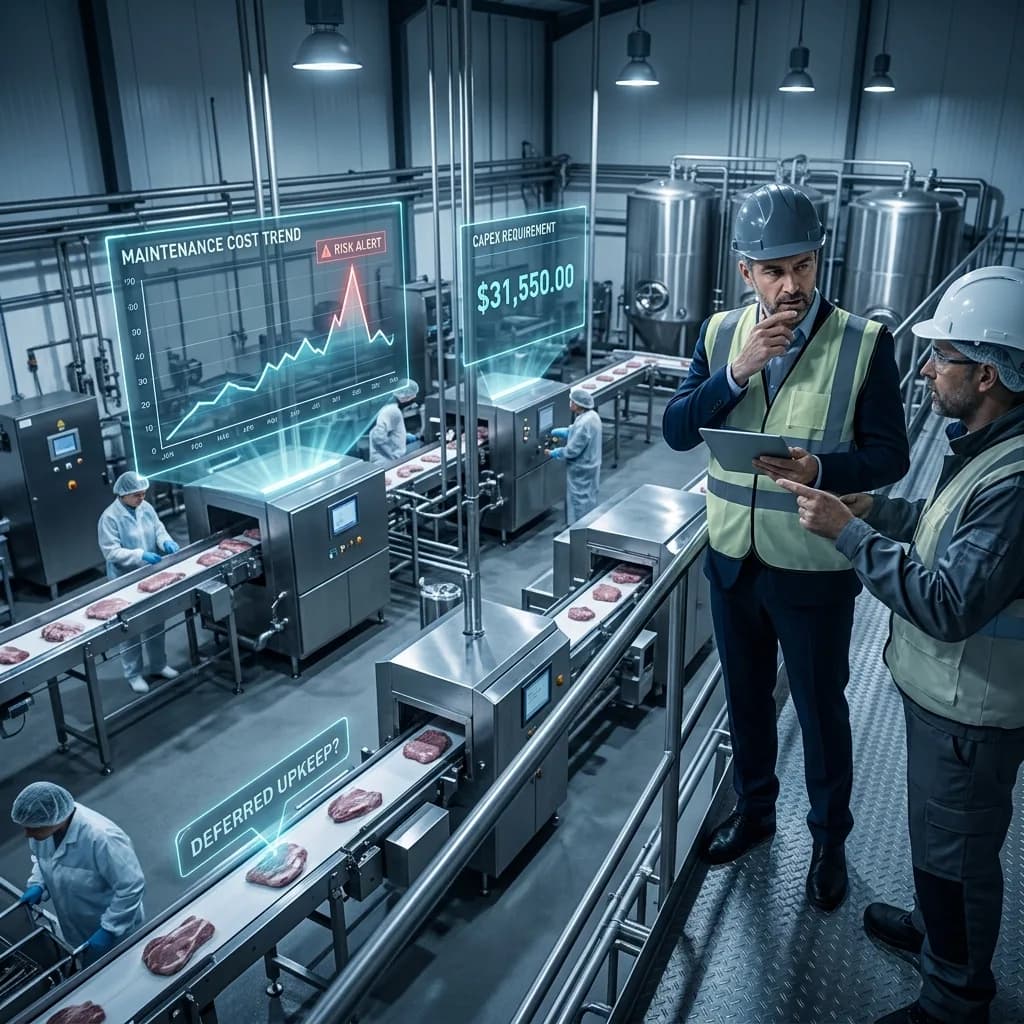
A $180M food processing acquisition nearly fell apart during final due diligence when the PE team discovered the target's flagship facility had $12M in deferred maintenance disguised as "routine upkeep." The plant manager had been deferring critical equipment overhauls for 18 months to hit EBITDA targets, creating a maintenance cliff that would require immediate post-close capex of $8-15M. What looked like a 12.5x EBITDA multiple suddenly became 14.2x when adjusted for true normalized earnings.
This scenario plays out more often than PE teams realize. Plant visits during due diligence are often treated as box-checking exercises rather than value discovery opportunities. Yet 73% of food & beverage deals require unplanned capex within 24 months of close, with an average impact of $2.3M per $100M enterprise value.
The $50M Problem: Why Most Plant Visits Miss Critical Issues
Traditional plant tours focus on the wrong metrics. Teams spend 90 minutes watching production lines run smoothly while missing the $3M refrigeration system running on borrowed time or the $1.8M wastewater treatment plant operating at 95% capacity with no expansion plan.
The cost of missing these issues compounds quickly. Unplanned equipment failures in food manufacturing average $47,000 per hour in lost production, plus regulatory fines averaging $180,000 for food safety violations. For a typical $200M revenue target, a single major equipment failure can reduce EBITDA by $2-4M annually.
Framework: The Four-Layer Plant Assessment
Effective plant due diligence requires a structured approach that moves beyond surface-level observations to uncover value creation opportunities and hidden risks.
Layer 1: Financial Foundation (30 minutes)
Focus on metrics that directly impact EBITDA and cash flow.
Layer 2: Operational Efficiency (45 minutes)
Identify improvement opportunities that drive margin expansion.
Layer 3: Risk Assessment (30 minutes)
Uncover hidden liabilities and regulatory exposure.
Layer 4: Growth Capacity (15 minutes)
Evaluate scalability without major capex.
Layer 1: Financial Foundation Questions
Start with questions that reveal the true cost structure and capital intensity of operations.
Equipment Age and Replacement Timeline "What's the average age of your top 10 most critical pieces of equipment, and when were they last overhauled?" Equipment over 15 years old in food processing typically requires 40% higher maintenance spend and has 3x higher unplanned downtime rates.
Maintenance Spend Analysis "Show me your maintenance spend as a percentage of asset value over the past three years." Best-in-class food facilities run 2.5-3.5% of asset value annually. Anything below 2% suggests deferred maintenance; above 4% indicates aging infrastructure or poor reliability practices.
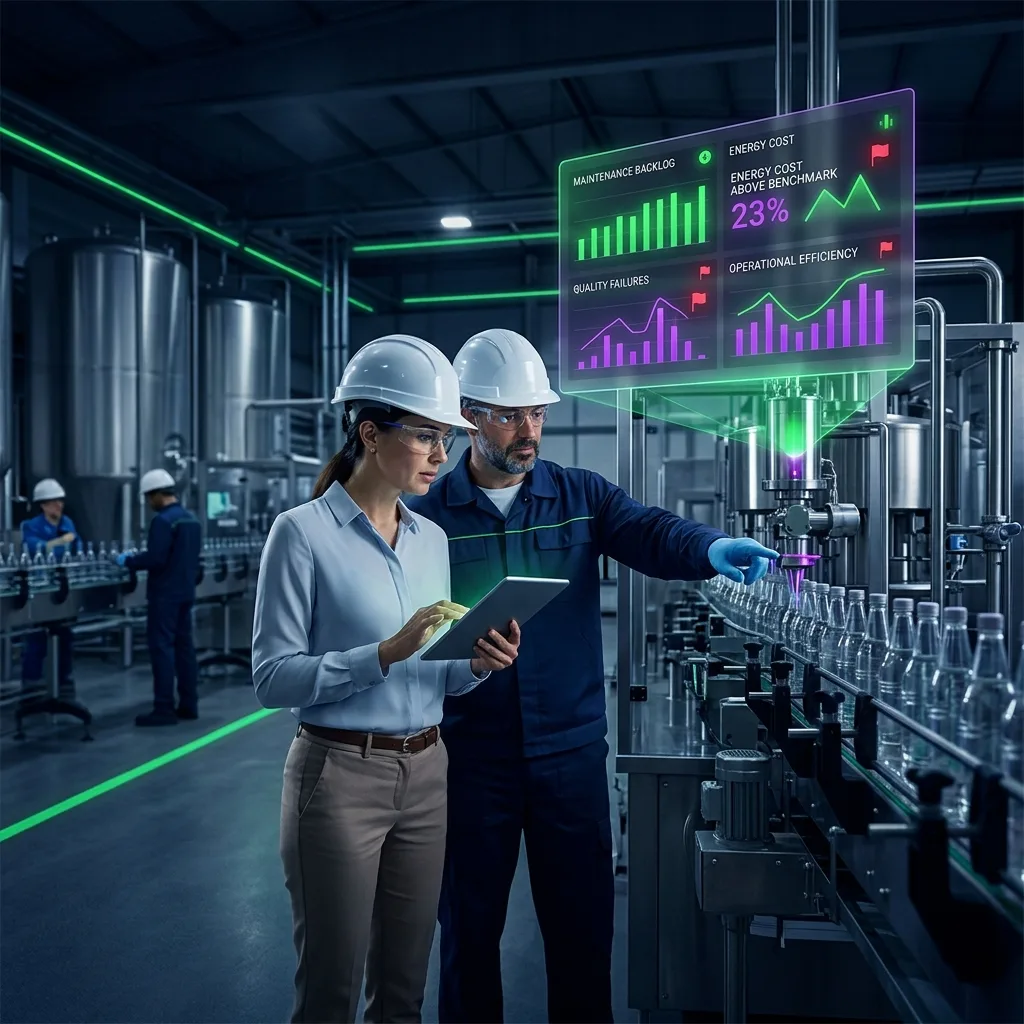
Utility Cost Benchmarking "What's your cost per pound produced for electricity, natural gas, and water?" Energy typically represents 8-12% of COGS in food manufacturing. Facilities in the top quartile achieve $0.08-0.12 per pound for energy costs, while bottom quartile runs $0.18-0.25.
| Utility Benchmarks (Cost per Pound Produced) | Top Quartile | Median | Bottom Quartile |
|---|---|---|---|
| Electricity | $0.03-0.04 | $0.06-0.08 | $0.12-0.15 |
| Natural Gas | $0.02-0.03 | $0.04-0.06 | $0.08-0.12 |
| Water/Wastewater | $0.01-0.02 | $0.03-0.04 | $0.06-0.08 |
| Total Energy | $0.08-0.12 | $0.15-0.20 | $0.28-0.35 |
Layer 2: Operational Efficiency Deep Dive
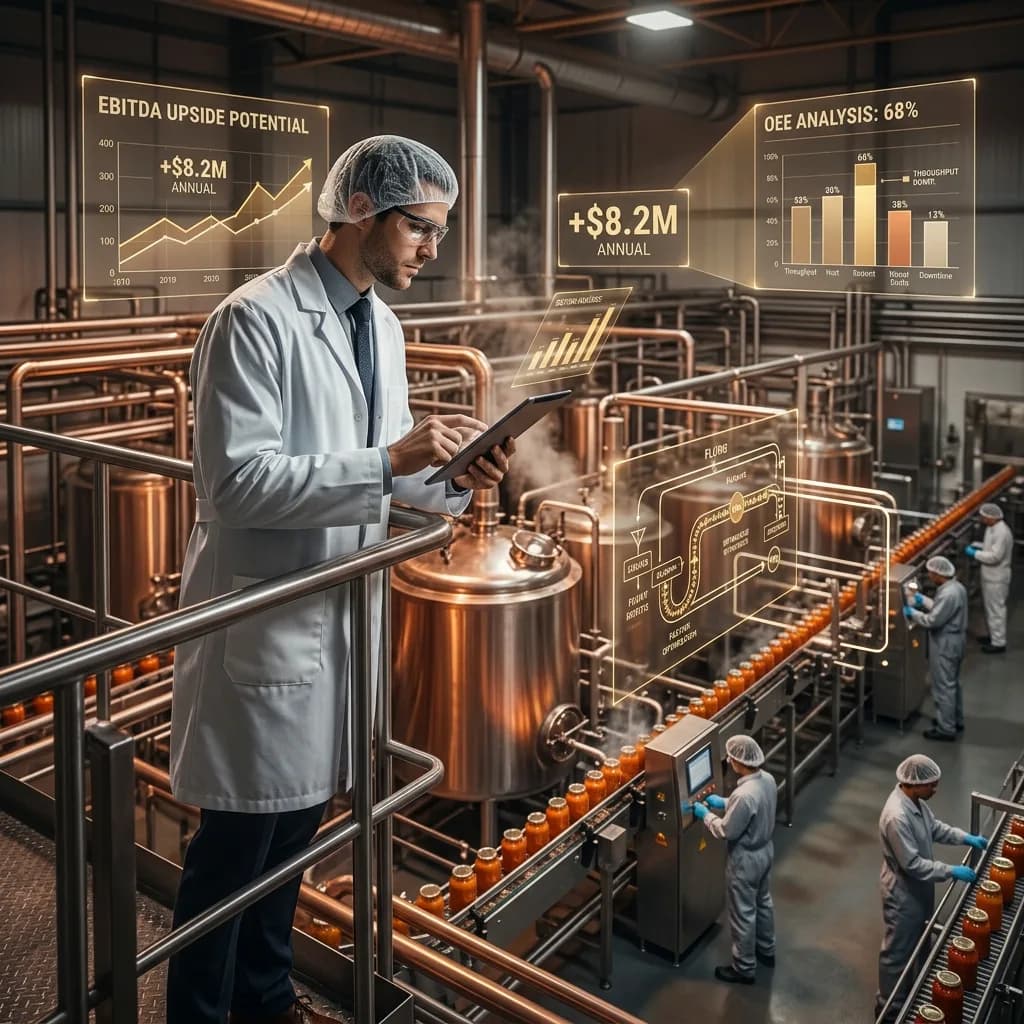
Overall Equipment Effectiveness (OEE) "What's your OEE by production line, and how do you track availability, performance, and quality losses?" World-class food manufacturing achieves 85%+ OEE. Each 1% improvement in OEE typically translates to $200,000-500,000 in annual EBITDA for a $100M revenue facility.
Labor Productivity Metrics "What's your labor cost as a percentage of revenue, and how many pounds per labor hour do you produce?" Top-performing facilities achieve 15-25 pounds per labor hour with labor costs of 12-18% of revenue. Improvement opportunities often yield $1-3M in annual savings for mid-market targets.
Waste and Yield Rates "What's your product yield percentage and waste disposal costs?" Food manufacturing waste typically runs 3-8% of raw material input. Each 1% yield improvement can add $500,000-2M annually to EBITDA depending on facility size and product mix.
Changeover Efficiency "How long does it take to switch between your top 5 SKUs, and how many changeovers do you run per week?" Reducing changeover time from 4 hours to 2 hours can increase capacity utilization by 8-12%, equivalent to $2-5M in avoided capex for expansion.
Layer 3: Risk Assessment Priorities
Regulatory Compliance Status "Show me your last three FDA, USDA, or state inspection reports and any outstanding corrective actions." Food safety violations can trigger $500,000-5M in recalls plus ongoing compliance costs of $200,000-800,000 annually.
Environmental Compliance "What are your wastewater discharge limits, and what percentage of capacity are you currently using?" Facilities operating above 85% of permitted discharge often face $2-8M in treatment system upgrades within 2-3 years.
Insurance and Safety Record "What's your OSHA recordable incident rate, and have you had any workers' compensation claims over $100,000 in the past three years?" Food manufacturing averages 4.1 incidents per 100 workers annually. Facilities with rates above 6.0 face insurance premium increases of 15-40%.
Supply Chain Vulnerabilities "What percentage of your raw materials come from single-source suppliers, and what's your average inventory turns?" Single-source dependencies above 30% of COGS create significant risk. Each additional turn of inventory typically frees up $1-3M in working capital.
| Risk Assessment Benchmarks | Low Risk | Moderate Risk | High Risk |
|---|---|---|---|
| FDA/USDA Inspection Score | 95-100 | 85-94 | Under 85 |
| Wastewater Capacity Usage | Under 70% | 70-85% | Over 85% |
| OSHA Incident Rate | Under 2.0 | 2.0-4.0 | Over 4.0 |
| Single-Source Suppliers (% of COGS) | Under 20% | 20-40% | Over 40% |
| Environmental Violations (3 years) | 0 | 1-2 | Over 2 |
Layer 4: Growth Capacity Evaluation
Throughput Constraints "What's your current capacity utilization by shift, and which piece of equipment is your bottleneck?" Facilities running above 85% utilization on their constraint typically need $5-15M in expansion capex within 18 months to support growth.
Facility Expansion Potential "How much additional square footage could you add on this site, and what are the zoning restrictions?" Expansion costs average $150-300 per square foot for food manufacturing space, plus $200-500 per square foot for specialized equipment.
Workforce Scalability "What's your current staffing level versus full capacity, and what's your average time to hire and train production workers?" Labor shortages in food manufacturing average 8-12% of required headcount, with training costs of $3,000-8,000 per production worker.
Critical Red Flags That Kill Deals
Immediate Deal Breakers
- Equipment with remaining useful life under 3 years representing over 20% of asset value
- Regulatory violations requiring >$5M in remediation
- Single points of failure that could shut down over 50% of production
- Union contracts expiring within 12 months with contentious negotiation history
Yellow Flags Requiring Price Adjustment
- Maintenance spend below 2% of asset value for over 2 years
- Utility costs in bottom quartile of benchmarks
- OEE below 70% with no improvement plan
- Environmental permits at over 80% capacity usage
Quantifying the EBITDA Impact
The financial impact of thorough plant due diligence extends far beyond avoiding surprises. A systematic assessment typically uncovers $2-8M in value creation opportunities for every $100M in revenue.
Immediate Post-Close Opportunities (Months 1-6)
- Energy optimization: $500,000-1.5M annually
- Waste reduction: $300,000-800,000 annually
- Maintenance optimization: $200,000-600,000 annually
Medium-Term Improvements (Months 6-18)
- OEE improvements: $1-3M annually
- Labor productivity: $800,000-2M annually
- Yield optimization: $500,000-2M annually
Strategic Capacity Planning (Months 12-24)
- Bottleneck elimination: $2-5M in avoided capex
- Automation opportunities: $1-4M in labor savings
- Regulatory compliance: $500,000-3M in avoided fines/shutdowns
For a typical $200M revenue food manufacturing target, comprehensive plant due diligence that uncovers these opportunities can improve EBITDA by $4-12M annually. At a 10x exit multiple, this translates to $40-120M in additional enterprise value — a 20-60% return on the initial investment for thorough technical due diligence.
The difference between a cursory plant tour and systematic technical assessment often determines whether a deal creates or destroys value. In food manufacturing, where operational excellence directly drives profitability, the plant visit isn't just due diligence — it's the foundation of your investment thesis.