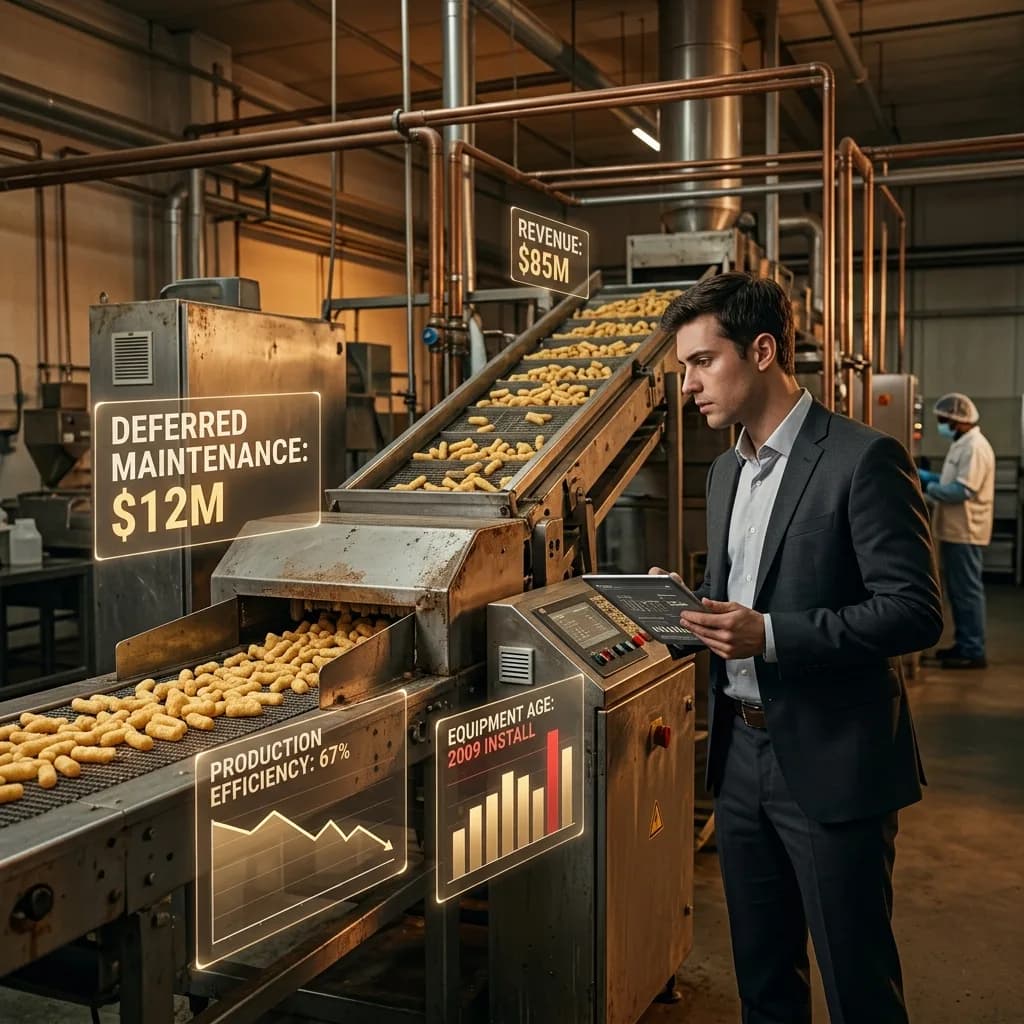
Your managing director just handed you the operational due diligence workstream for a $180M acquisition of MidWest Snacks, a regional manufacturer producing 45 million pounds of extruded corn snacks annually across three facilities. The company generates $85M in revenue with 18% EBITDA margins, but the seller's CIM glosses over operational details with generic phrases like "state-of-the-art equipment" and "experienced workforce."
Three weeks later, your operational consultant discovers the main production line hasn't been upgraded since 2009, requires $12M in deferred maintenance, and operates at 67% efficiency compared to industry benchmarks. What looked like a 5.2x EBITDA multiple suddenly becomes 6.8x when you factor in immediate capital requirements and lost production capacity. The deal team scrambles to renegotiate, ultimately reducing the purchase price by $25M.
This scenario plays out across hundreds of manufacturing deals annually. According to Bain's 2023 Global Private Equity Report, 34% of deal value destruction stems from operational issues identified post-close rather than during due diligence. For junior analysts, understanding operational due diligence fundamentals can mean the difference between a successful platform investment and a value trap.
The $50M Question: Why Operational DD Matters
Manufacturing businesses live or die by their operational efficiency. A 5% improvement in overall equipment effectiveness (OEE) typically translates to 15-25% EBITDA uplift in food manufacturing, while unidentified operational risks can destroy 20-40% of projected returns.
Consider the financial impact across common operational issues:
| Operational Risk | Typical Cost Impact | EBITDA Multiple Effect |
|---|---|---|
| Deferred maintenance backlog | $8-15M for mid-market food plants | +0.8-1.2x multiple |
| Below-benchmark efficiency | 10-20% lost EBITDA annually | +1.5-2.0x multiple |
| Regulatory compliance gaps | $2-8M remediation + downtime | +0.5-1.0x multiple |
| Key person dependency | 15-30% productivity loss risk | Deal structure changes |
The math is straightforward: operational issues compound. A plant running at 65% OEE instead of industry-standard 85% isn't just 20% less efficient—it's generating 23% less throughput per dollar of fixed cost, assuming 15% variable cost margins.
The Operational DD Framework: Four Pillars
Effective operational due diligence follows a structured approach across four critical areas, each requiring 15-25 hours of analysis for a typical $100-300M manufacturing deal.
Production Capacity & Efficiency Analysis
Start with the numbers that matter: actual versus theoretical capacity, utilization rates, and efficiency benchmarks. Request three years of production data including:
- Monthly production volumes by SKU and line
- Planned versus unplanned downtime (target: under 8% total downtime)
- Overall Equipment Effectiveness by major asset
- Labor productivity metrics (units per labor hour)
- Quality metrics (first-pass yield, rework rates)
For MidWest Snacks, this analysis revealed their flagship extruder operated at 67% OEE versus the 85% industry benchmark. At $1.89 revenue per pound and 35% gross margins, this efficiency gap cost $8.2M in annual gross profit—money left on the table that a strategic buyer could capture through operational improvements.
Asset Condition & Capital Requirements
Manufacturing assets follow predictable depreciation curves, but deferred maintenance creates hidden liabilities. Develop a systematic approach to asset evaluation:
Immediate Assessment (Week 1-2):
- Equipment age analysis by production line
- Maintenance records review for past 24 months
- Capital expenditure history and future projections
- Energy consumption trends (often indicates equipment degradation)
Detailed Technical Review (Week 3-4):
- Third-party equipment condition assessments
- Regulatory compliance status (FDA, OSHA, environmental)
- Technology benchmarking against industry standards
- Replacement cost analysis for critical assets
A well-maintained food manufacturing facility typically requires annual capex of 3-4% of revenue for maintenance plus 1-2% for growth investments. Facilities with deferred maintenance often need 8-12% of revenue in catch-up capex over 18-24 months.
Supply Chain & Procurement Leverage
Manufacturing margins depend heavily on input costs and supply chain efficiency. Procurement typically represents 45-65% of revenue in food manufacturing, making supplier relationships and contract terms critical value drivers.
Key analysis areas include:
- Supplier concentration (red flag: over 40% spend with single supplier)
- Contract terms and pricing mechanisms
- Inventory turns and working capital efficiency
- Logistics costs as percentage of revenue
- Forward commodity hedging strategies
| Supply Chain Metric | Industry Benchmark | Red Flag Threshold |
|---|---|---|
| Inventory turns | 8-12x annually | Under 6x annually |
| Supplier concentration | Under 30% top supplier | Over 50% top supplier |
| Logistics cost | 3-5% of revenue | Over 7% of revenue |
| Days payable outstanding | 35-45 days | Under 25 days |
Workforce & Management Capabilities
Manufacturing success depends on operational expertise that often walks out the door post-acquisition. Assess both current capabilities and retention risks:
- Management depth and experience (years in role, industry background)
- Key person dependencies and succession planning
- Labor cost trends and union relationships
- Training programs and safety performance
- Organizational structure and decision-making processes
Plants with strong management teams typically show consistent performance metrics, proactive maintenance cultures, and continuous improvement initiatives. Warning signs include high management turnover, reactive maintenance approaches, and deteriorating safety metrics.
Red Flags That Kill Deals
Certain operational issues should trigger immediate concern or deal restructuring. Based on analysis of 200+ food manufacturing transactions, these red flags correlate with significant value destruction:
Category A: Deal Killers (Consider walking away)
- Regulatory consent decree or FDA warning letters
- Environmental contamination requiring >$10M remediation
- Single customer representing over 60% of revenue
- Critical equipment beyond economic repair life
Category B: Value Adjusters (Renegotiate price/terms)
- Deferred maintenance >$5M or 6% of revenue
- OEE consistently under 70% without clear improvement plan
- Management team with under 3 years average tenure
- Working capital over 15% of revenue
Category C: Post-Close Priorities (Factor into 100-day plan)
- Energy costs over 8% of revenue
- Inventory turns under 6x annually
- Safety incidents trending upward
- Limited automation/technology adoption
The Numbers Behind Operational Value Creation
Understanding the financial impact of operational improvements helps justify investment theses and post-acquisition value creation plans. Here's how operational metrics translate to EBITDA and valuation:
OEE Improvement Impact: A 10-percentage-point OEE improvement (e.g., 70% to 80%) typically generates:
- 12-15% increase in production capacity
- 8-10% reduction in unit costs (fixed cost absorption)
- 15-20% EBITDA improvement
- 1.5-2.0x multiple expansion at exit
Working Capital Optimization: Reducing working capital from 18% to 12% of revenue for a $100M revenue business:
- Frees up $6M in cash
- Improves cash conversion cycle
- Increases IRR by 200-300 basis points over 5-year hold
Energy Efficiency Programs: Food manufacturing energy costs average 4-6% of revenue. A comprehensive energy program typically:
- Reduces energy consumption 15-25%
- Generates $1.5-3M annual savings for $100M revenue business
- Pays back initial investment in 18-24 months
- Improves sustainability metrics for ESG-focused buyers
Building Your Operational DD Toolkit
Successful operational due diligence requires systematic data collection and analysis. Develop standardized templates and checklists to ensure consistency across deals:
Week 1: Data Request and Initial Analysis
- Production and financial data (36 months)
- Organizational charts and key personnel bios
- Equipment lists and maintenance records
- Regulatory and compliance documentation
Week 2-3: Site Visits and Management Interviews
- Plant tours with production and maintenance managers
- Deep-dive interviews with operations leadership
- Customer and supplier reference calls
- Third-party technical assessments
Week 4: Synthesis and Recommendations
- Operational risk assessment and mitigation strategies
- Capital requirement analysis and timing
- Value creation opportunity quantification
- Integration planning considerations
Tying Operations to Investment Returns
The ultimate goal of operational due diligence is understanding how operational performance drives investment returns. For manufacturing businesses, this connection is direct and measurable.
Consider a typical food manufacturing investment: $150M purchase price, $90M revenue, 16% EBITDA margins. Operational improvements over a 5-year hold period might include:
- OEE improvement from 72% to 85%: +$8M annual EBITDA
- Working capital optimization: +300 bps IRR
- Energy efficiency program: +$2M annual EBITDA
- Automation investments: +$4M annual EBITDA
Combined, these improvements increase EBITDA from $14.4M to $28.4M—a 97% improvement that transforms a 5.2x entry multiple into a 2.6x effective multiple. At a 7x exit multiple, this operational value creation adds $98M in enterprise value, generating a 3.2x money multiple versus 1.8x without operational improvements.
The lesson for junior analysts is clear: operational due diligence isn't just risk mitigation—it's the foundation of value creation in manufacturing deals. Master these fundamentals, and you'll identify the operational levers that separate winning investments from value traps. In an environment where deal multiples remain elevated, operational excellence often provides the margin of safety that makes good deals great.