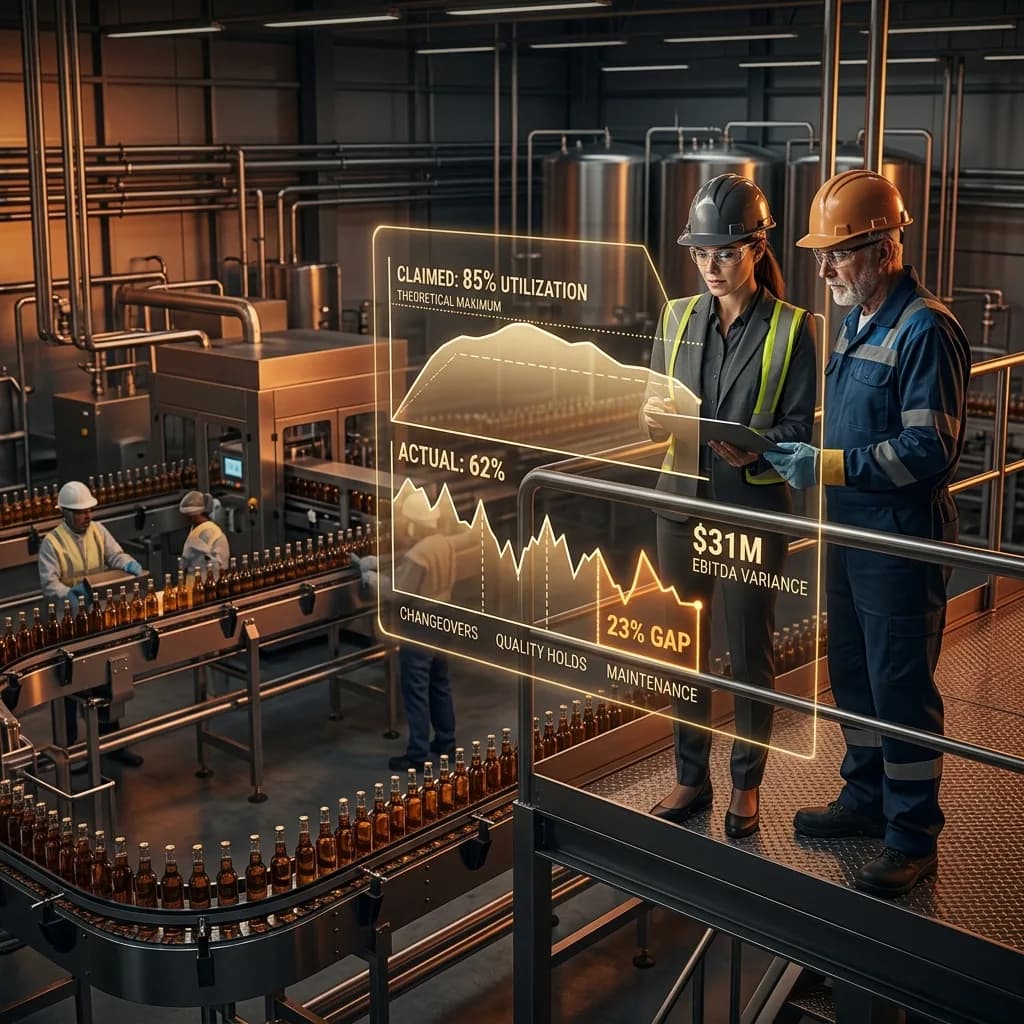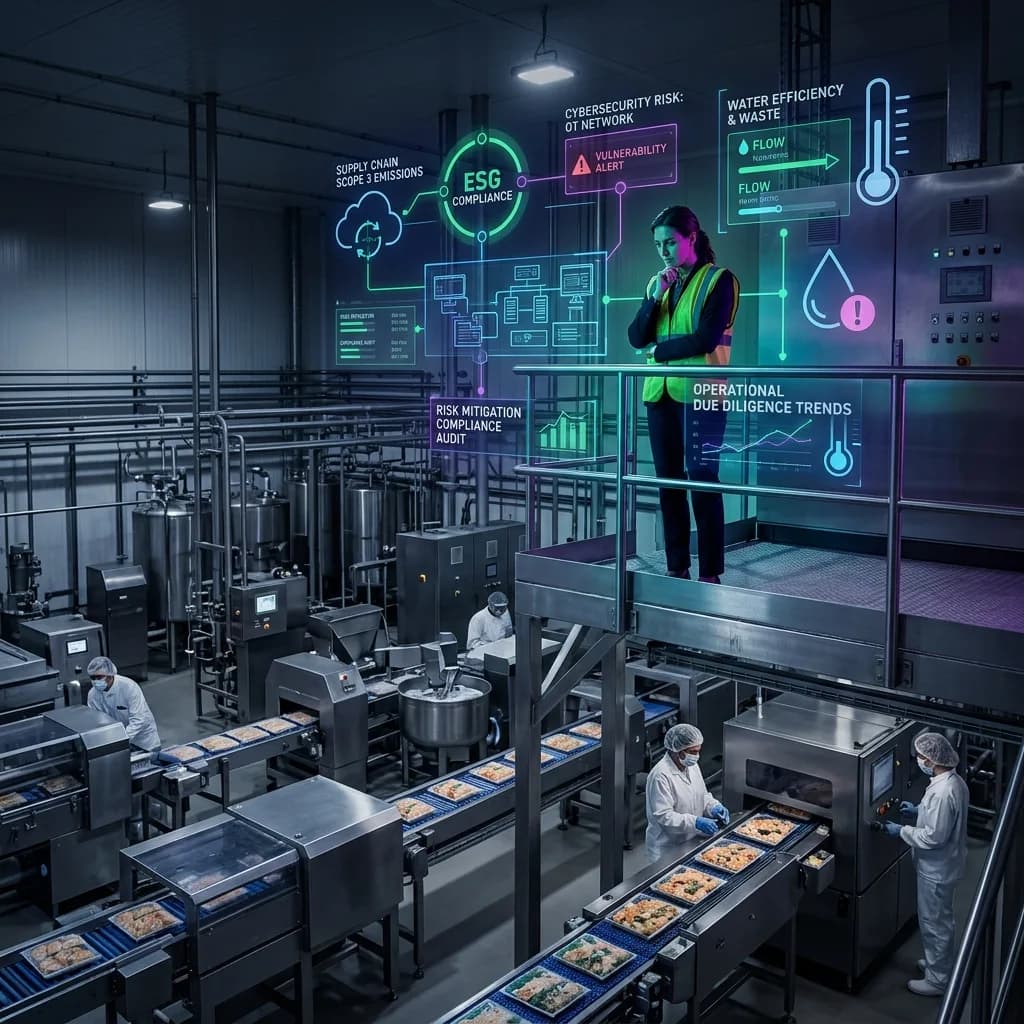
A PE firm closes on a $65M frozen foods platform in Q3 2025. The operational DD followed the standard playbook: equipment condition assessments, maintenance history review, regulatory compliance check, workforce interviews. Six months post-close, the firm discovers $2.1M in unplanned capital needs — not from equipment failure, but from cybersecurity vulnerabilities in the OT network, water discharge violations that trigger a $350K remediation project, and an ESG gap that costs them a $12M co-packing contract with a major retailer demanding Scope 3 emissions data from suppliers.
The traditional operational DD playbook was built for a different era. In 2026, the scope of what constitutes "operational risk" in food manufacturing has expanded dramatically. Deal teams still running the 2018 checklist are systematically missing value-destroying risks — and value-creation opportunities — that modern operational DD must capture.
Here are seven trends reshaping how sophisticated PE firms conduct operational due diligence on food manufacturing targets.
1. AI-Powered Facility Assessments
What it is: Computer vision and machine learning tools that augment — and in some cases replace — subjective human assessments during plant tours. Thermal imaging drones scan rooflines, electrical panels, and refrigeration systems. Vibration analytics platforms process months of sensor data to model remaining useful life on critical assets. AI-driven document analysis tools parse 10 years of maintenance records in hours rather than days.
Why it matters for deal teams: Traditional facility assessments rely heavily on the experience of the individual conducting the walkthrough. Two engineers touring the same plant may produce materially different findings. AI-powered tools reduce subjectivity and catch degradation patterns invisible to the human eye — a compressor losing 0.3% efficiency per month, a bearing vibration signature trending toward failure within 90 days.
How to evaluate it during DD: Request 12 months of sensor data from the target's CMMS or SCADA system. Run vibration and thermal analytics on critical rotating equipment. Use document parsing tools to extract maintenance completion rates, mean time between failure (MTBF) trends, and parts replacement patterns.
EBITDA/valuation impact: AI-powered assessments typically identify 30-50% more deferred maintenance than traditional walkthroughs. On a $50M facility, this commonly surfaces an additional $400K-$900K in deferred CapEx that belongs in the enterprise value bridge.
2. ESG and Sustainability Integration into DD
What it is: Environmental, social, and governance metrics evaluated not as a compliance checkbox but as a commercial and operational risk factor. Major food retailers — Walmart, Kroger, Costco — now require suppliers to report Scope 1, 2, and 3 emissions. Facilities without measurement infrastructure face contract risk.
Why it matters for deal teams: A $30M dairy processing facility that cannot provide emissions data to its top 3 customers (representing 60% of revenue) faces measurable revenue concentration risk. Conversely, a facility with solar generation, biogas capture from wastewater, or verified water reduction programs commands premium positioning with sustainability-conscious buyers at exit.
How to evaluate it during DD:
| ESG Factor | Key Metric | Red Flag Threshold | Green Flag Threshold |
|---|---|---|---|
| Energy intensity | BTU per lb of product | over 3,500 BTU/lb (protein) | under 2,200 BTU/lb (protein) |
| Water intensity | Gallons per lb of product | over 8 gal/lb (dairy) | under 4 gal/lb (dairy) |
| Waste diversion rate | % of waste diverted from landfill | under 40% | over 85% |
| Scope 1+2 emissions tracking | Measurement maturity | No measurement system | Verified annual reporting |
| Supplier sustainability requirements | Customer contract clauses | over 30% revenue at risk | Full compliance |
EBITDA/valuation impact: Facilities with documented sustainability programs trade at 0.3-0.5x EBITDA premium at exit. Facilities facing customer sustainability mandates without compliance infrastructure carry $200K-$600K in implementation cost that should be modeled as a post-close CapEx adjustment.
3. Supply Chain Resilience Scoring
What it is: Quantitative frameworks that score a target's vulnerability to supply chain disruption — single-source ingredients, geographic concentration of suppliers, inventory buffer adequacy, and lead time variability.
Why it matters for deal teams: A frozen meal manufacturer sourcing 70% of its protein from a single supplier in a single geography carries concentration risk that doesn't appear on the income statement — until that supplier faces a disease outbreak, weather event, or logistics disruption. Post-COVID deal teams treat supply chain resilience as a core operational DD dimension.
How to evaluate it during DD: Request the target's top 20 ingredients by spend. Map each to supplier count, geographic origin, lead time, and substitute availability. Score concentration risk.
| Risk Dimension | Low Risk (1) | Medium Risk (3) | High Risk (5) |
|---|---|---|---|
| Supplier count per ingredient | 3+ qualified | 2 qualified | Single source |
| Geographic concentration | Multi-region | Single region, multi-supplier | Single supplier, single origin |
| Lead time buffer | over 30 days safety stock | 15-30 days | under 15 days |
| Substitute availability | Drop-in replacement exists | Reformulation required | No viable substitute |
| Contract coverage | over 80% volume under contract | 50-80% | under 50% spot purchasing |
EBITDA/valuation impact: High supply chain risk scores (weighted average over 3.5) correlate with 2-4 unplanned production disruptions per year, costing $150K-$500K each in lost production, expedited freight, and customer penalties.
4. Predictive Maintenance as a DD Signal
What it is: Using the maturity of a target's maintenance program — reactive vs. preventive vs. predictive vs. prescriptive — as a leading indicator of operational excellence and future CapEx requirements.
Why it matters for deal teams: Facilities operating in reactive maintenance mode spend 3-5x more on maintenance per unit of production than facilities running predictive programs. A $40M facility spending $1.8M annually on reactive maintenance could reduce that to $900K-$1.1M with a predictive program — but the implementation costs $200K-$400K and takes 12-18 months.
How to evaluate it during DD: Request the CMMS work order history. Calculate the ratio of planned vs. unplanned work orders. Benchmark maintenance cost as a percentage of replacement asset value (RAV).
- Reactive (Level 1): over 60% unplanned work orders, maintenance cost 4-6% of RAV
- Preventive (Level 2): 40-60% unplanned, maintenance cost 2.5-4% of RAV
- Predictive (Level 3): 20-40% unplanned, maintenance cost 1.5-2.5% of RAV
- Prescriptive (Level 4): under 20% unplanned, maintenance cost 1-1.5% of RAV
EBITDA/valuation impact: Each level of maintenance maturity improvement typically yields 1-2% of RAV in annual savings. For a facility with $25M in replacement asset value, moving from reactive to predictive maintenance represents $375K-$625K in annual EBITDA improvement — a compelling 100-day plan item.
5. Cybersecurity in OT Systems
What it is: Assessment of operational technology (OT) network security in food manufacturing facilities — SCADA systems, PLCs, HMIs, and the increasingly connected IoT sensor networks that control production.
Why it matters for deal teams: Food manufacturing OT environments are 5-8 years behind IT in security maturity. A ransomware attack on a facility's SCADA system can halt production for 1-3 weeks. The average cost of an OT cybersecurity incident in food manufacturing is $2.8M when accounting for production loss, recovery, and customer penalties. Insurance underwriters are now requiring OT security assessments, and facilities without them face 40-60% higher premiums.
How to evaluate it during DD: Assess network segmentation between IT and OT. Identify remote access points to the OT network. Determine firmware patch levels on PLCs and HMIs. Check for default passwords on control systems (an alarmingly common finding). Verify backup and recovery procedures for control system configurations.
EBITDA/valuation impact: OT cybersecurity remediation typically costs $150K-$400K for a mid-market food facility. Failing to identify the gap during DD means this cost surfaces post-close as an unplanned CapEx item — or worse, as a $2M+ incident response when a breach occurs.
6. Water and Wastewater Compliance as Deal-Breaker
What it is: Deep-dive assessment of a facility's water sourcing, usage efficiency, and discharge compliance — including emerging contaminants (PFAS, microplastics) and tightening discharge limits.
Why it matters for deal teams: Water is the most underpriced and under-assessed utility in food manufacturing DD. EPA and state agencies are aggressively tightening discharge limits for BOD, TSS, fats/oils/grease, and emerging contaminants. A facility discharging under a 2019 permit may face a permit renewal in 2026-2027 that requires $500K-$2M in wastewater treatment upgrades.
How to evaluate it during DD: Request 24 months of discharge monitoring reports (DMRs). Identify any exceedances or notices of violation. Determine the permit renewal timeline. Assess whether the current treatment system can meet anticipated tighter limits. Evaluate water sourcing risk — groundwater depletion, municipal allocation restrictions.
EBITDA/valuation impact: Wastewater non-compliance remediation ranges from $300K for upgraded screening and DAF systems to $3M+ for full biological treatment installation. Municipal surcharges for high-strength discharge can run $100K-$400K annually. These costs are frequently missed in DD because the target may be technically "in compliance" today while facing near-certain compliance gaps within 18-24 months.
7. Workforce Capability Assessment
What it is: Structured evaluation of the target's workforce — not just headcount and labor cost, but skills depth, key-person dependency, training maturity, and the facility's ability to attract and retain talent in a tightening labor market.
Why it matters for deal teams: Food manufacturing faces a structural labor shortage. Facilities in rural locations with aging workforces and no formal training programs face 35-50% annual turnover, with each hourly employee replacement costing $8K-$12K in recruiting, training, and lost productivity. A facility with 200 hourly employees and 45% turnover is spending $720K-$1.08M annually just to maintain headcount.
How to evaluate it during DD: Analyze turnover rates by department and tenure bracket. Identify key-person dependencies (the maintenance manager who is the only person who can troubleshoot the ammonia system). Assess training program formality — documented SOPs, cross-training matrices, certification tracking. Evaluate wage competitiveness against local market benchmarks.
EBITDA/valuation impact: Reducing turnover from 45% to 25% on a 200-person workforce saves $160K-$240K annually. Eliminating key-person dependencies through cross-training reduces operational risk that should be reflected in the risk-adjusted discount rate.
Trend Comparison Summary
| Trend | Typical DD Gap | Remediation Cost | Annual EBITDA Impact | Timeline to Address |
|---|---|---|---|---|
| AI-powered assessments | 30-50% more deferred maintenance found | $50K-$100K (assessment tools) | $400K-$900K identified savings | 2-4 weeks |
| ESG/sustainability | Revenue risk from non-compliance | $200K-$600K implementation | 0.3-0.5x multiple premium at exit | 6-12 months |
| Supply chain resilience | Unquantified concentration risk | $50K-$150K (qualification/contracts) | $300K-$2M avoided disruption cost | 3-6 months |
| Predictive maintenance | Reactive maintenance overspend | $200K-$400K implementation | $375K-$625K annual savings | 12-18 months |
| OT cybersecurity | Unassessed breach exposure | $150K-$400K remediation | $2.8M average incident avoidance | 3-6 months |
| Water/wastewater | Pending compliance gaps | $300K-$3M+ treatment upgrades | $100K-$400K surcharge avoidance | 6-18 months |
| Workforce capability | Hidden turnover cost | $75K-$200K (training systems) | $160K-$240K turnover reduction | 6-12 months |
The Bottom Line for Deal Teams
The food manufacturing operational DD playbook has expanded from a primarily mechanical and regulatory exercise to a multi-dimensional risk and value assessment. Deal teams that incorporate these seven dimensions into their standard DD framework will consistently identify $1M-$3M in additional risk exposure or value creation opportunity on a typical $40M-$80M platform acquisition.
The firms that win in 2026 aren't just asking "does the equipment work?" They're asking whether the facility is positioned to meet the operational, environmental, digital, and workforce demands of the next 5-7 years — the hold period that determines whether this investment delivers a 2.5x return or a 1.2x disappointment.
Build these seven dimensions into your DD scope of work. Staff your deal teams with specialists who can evaluate each one. And price what you find into the enterprise value bridge — because if you don't, the seller's next buyer will.